. 2009 Jun;136(12):1977-86.
doi: 10.1242/dev.030718. Epub 2009 May 13.

Myosin II regulates extension, growth and patterning in the mammalian cochlear duct

Affiliations

Myosin II regulates extension, growth and patterning in the mammalian cochlear duct

Norio Yamamoto et al. Development. 2009 Jun.

Abstract

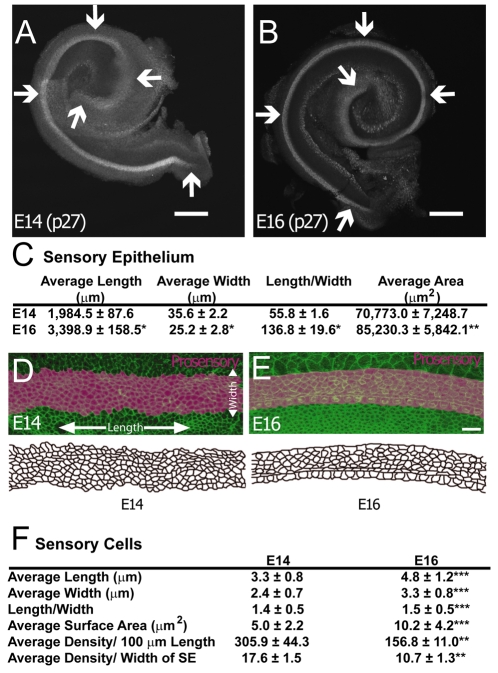
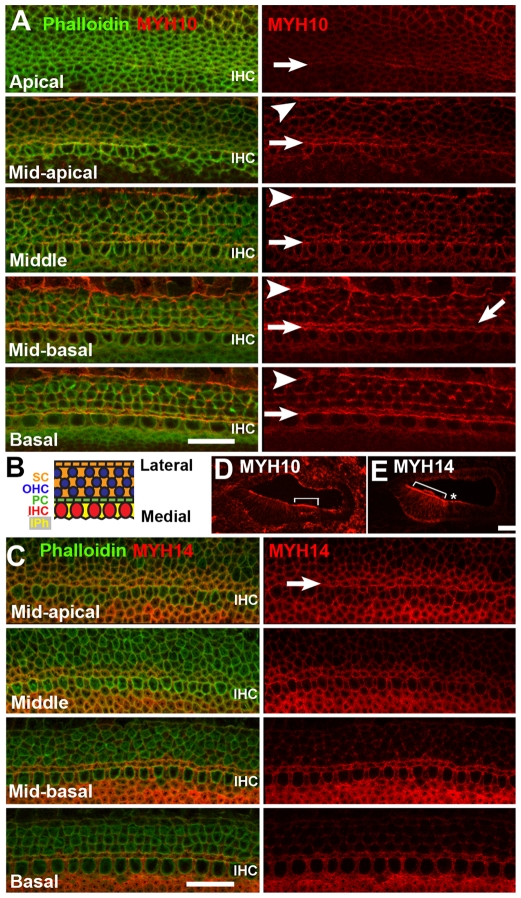
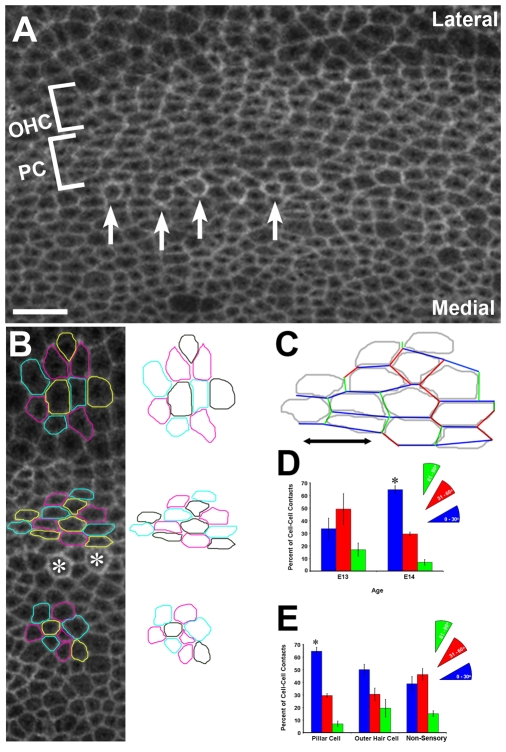
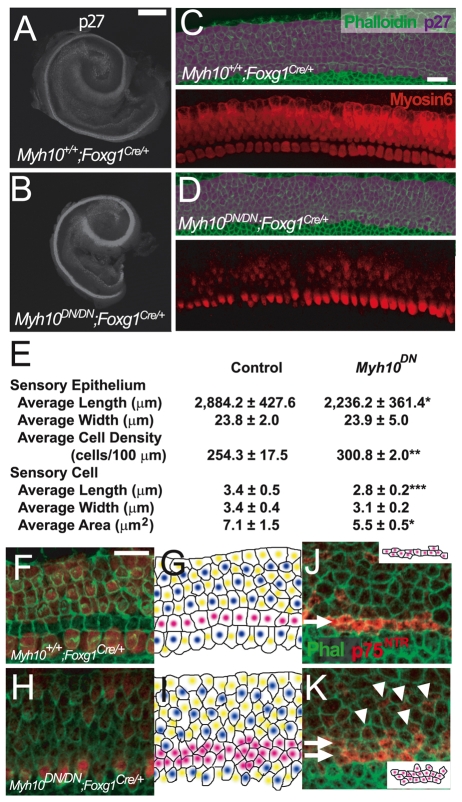
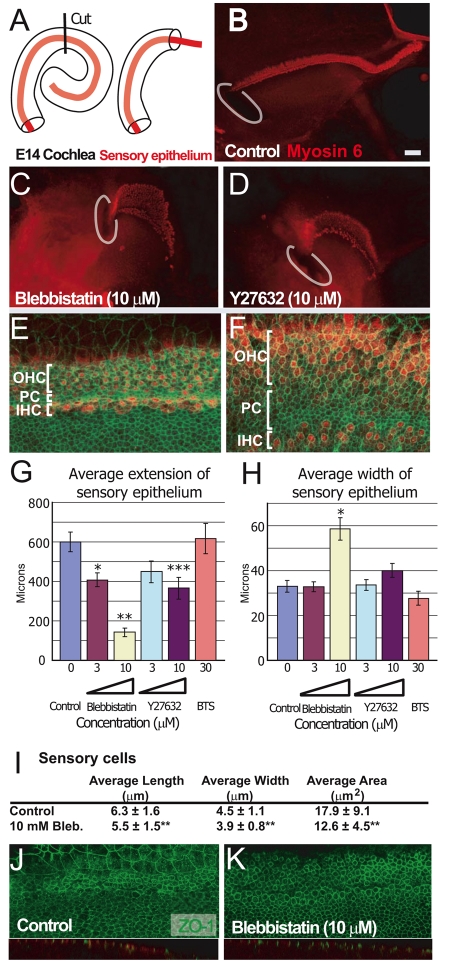
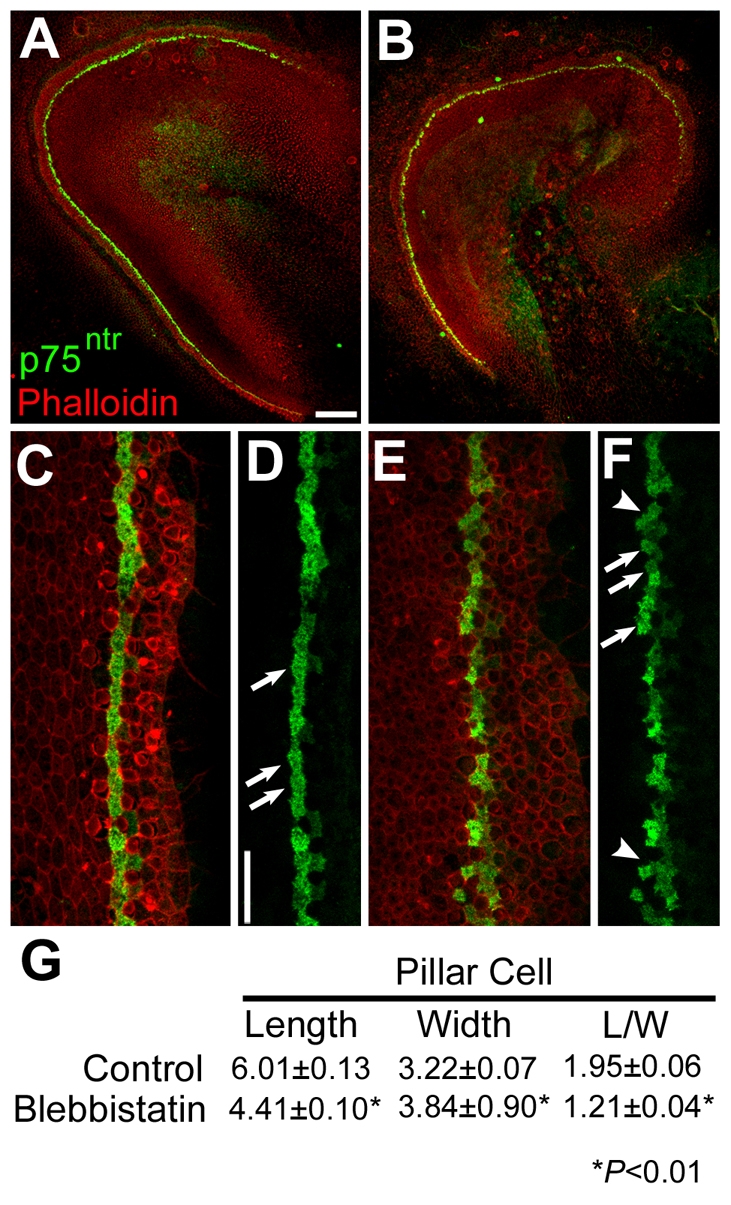
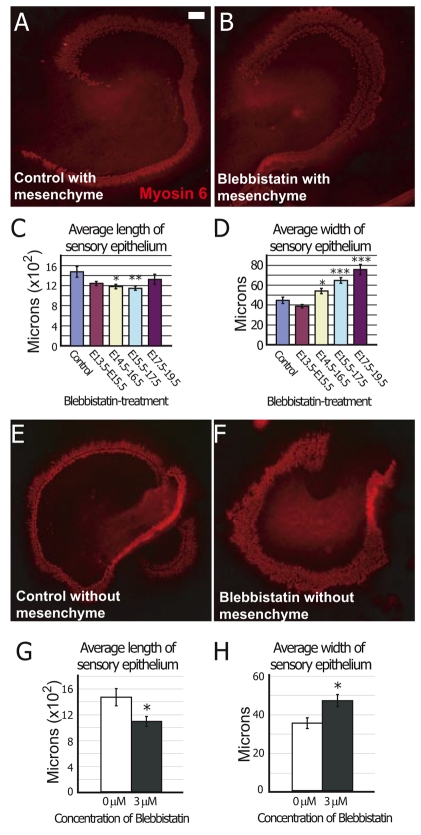
The sensory epithelium of the mammalian cochlea comprises mechanosensory hair cells that are arranged into four ordered rows extending along the length of the cochlear spiral. The factors that regulate the alignment of these rows are unknown. Results presented here demonstrate that cellular patterning within the cochlea, including the formation of ordered rows of hair cells, arises through morphological remodeling that is consistent with the mediolateral component of convergent extension. Non-muscle myosin II is shown to be expressed in a pattern that is consistent with an active role in cellular remodeling within the cochlea, and genetic or pharmacological inhibition of myosin II results in defects in cellular patterning that are consistent with a disruption in convergence and extension. These results identify the first molecule, myosin II, which directly regulates cellular patterning and alignment within the cochlear sensory epithelium. Our results also provide insights into the cellular mechanisms that are required for the formation of highly ordered cellular patterns.


Figures

Fig. 1.
Fig. 1.
Convergence and extension of the cochlear prosensory domain. (A,B) Whole mounts of the cochlea at E14 (A) and E16 (B). The prosensory domain is marked by expression of p27Kip1 (arrows). Note the extension and narrowing of the prosensory domain (arrows) that occurs between E14 and E16. (C) Comparison of changes in length, width, length/width ratio and surface area of the sensory epithelium between E14 and E16. There is a significant increase in length, a significant decrease in width and a significant increase in overall area. (D,E) Phalloidin labeling (green) of cell-cell boundaries in the cochlear duct. The prosensory domain is illustrated in violet. Arrows in D indicate orientation of length and width axes. The lower aspect of each panel illustrates outlines for individual cells within the prosensory domain. (F) Comparison of changes in length, width, length/width ratio, surface area, and cell density per unit length and across the width of the sensory epithelium between E14 and E16. The decrease in density of cells along the width of the epithelium is consistent with ongoing convergence. Scale bars: 200 μm in A,B; 10 μm in E (same magnification in D). *P<0.005, **P<0.05, ***P<0.0001.
Fig. 2.
Fig. 2.
Distribution of MYH10 and MYH14 along the basal-to-apical axis of the cochlea at E16.5. (A) In the apical region, MYH10 distribution (red) is largely uniform at all cell boundaries, with the exception of a faint line of increased intensity (arrow) near the medial edge of the sensory epithelium (see Fig. 2B for diagram of cellular pattern in mature OC). The position of developing inner hair cells (IHC) is indicated for orientation. In the mid-apical and middle regions, two lines are present, a line located between IHCs and IPCs (arrow) that is continuous with the line in the apical region, and a second line located at the extreme lateral edge of the OC (arrowhead). In the mid-basal region, a third line located at the boundary between IPCs and OHCs is also present (angled arrow). In the basal region shorter lines are also present between each row of OHCs. (B) Diagram illustrating the cellular pattern in the OC. (C) Distribution of MYH14 (red). In the mid-apical region, MYH14 is uniformly distributed with slightly brighter labeling at the boundary between IHCs and IPCs (arrow). In more mature regions, MYH14 is prominent at all boundaries of PCs, IHCs and IPhs but labeling is considerably reduced in the OHC region. (D,E) Cross-sections through the cochlear duct at E16.5 illustrating the distribution of MYH10 (D) and MYH14 (E). Bracket indicates the sensory epithelium in D and Kolliker's organ in E. Asterisk in E indicates the sensory epithelium. IHC, Inner hair cell; IPh, Inner phalangeal cell; IPC, Inner pillar cell; OPC, Outer pillar cell; OHC, Outer hair cell; SC, Supporting cell. Scale bars: 10 μm in A,C; 15 μm in E (same magnification in D).
Fig. 3.
Fig. 3.
Developing pillar cells undergo cell shape changes that are consistent with CE. (A) Middle region of the cochlea at E14. Cells located in the developing pillar cell (PC) and outer hair cell (OHC) domains, adjacent to developing inner hair cells (arrows), appear flattened. (B) Outlines of individual cells (colored for clarity) in three different regions of the cochlea. See A for orientation. Cells located adjacent to developing inner hair cells (asterisks) are flattened in comparison with cells located medial or lateral to the developing sensory epithelium. (C) Cell boundaries were classified as either parallel (0° to 30°, blue), perpendicular (61° to 90°, green) or intermediate (31° to 60°, red) to the axis of extension (black two-headed arrow). (D) Comparison of the ratios of different orientations of cell boundaries, as described in C, within the sensory epithelium between E13 and E14. Parallel boundaries are increased at the expense of intermediate and perpendicular boundaries. (E) Comparison of cell boundaries as in D, in different regions within the same cochlea at E14. A significantly greater proportion of cell-cell boundaries are oriented parallel to the axis of extension in the pillar cell region as compared with a non-sensory region. The outer hair cell region shows a similar distribution of boundary orientations, but values were not significantly different from the non-sensory region. Data for E14 pillar cell region are the same as for E14 in D. Scale bar: 10 μm. *P<0.01.
Fig. 4.
Fig. 4.
Myh10DN inhibits CE and disrupts cellular patterning. (A,B) Whole mounts of E16 cochleae from a control (A) and an Myh10DN mutant (B). The prosensory domain is marked by p27Kip1. Note that the sensory epithelium appears shorter along the length and wider in the apex in the mutant. (C) Upper panel illustrates individual cell boundaries within the developing sensory epithelium (violet) in the middle region of the cochlea from a control embryo at E16. Lower panel illustrates pattern of hair cells (red). (D) Similar view as in C, except from an Myh10DN mutant. Cellular pattern is disrupted, average cell size appears smaller and expression of myosin 6 is decreased as compared with the control, which could be a result of direct downregulation. Also, alignment of hair cells is disrupted. (E) Quantification of changes in morphometric parameters. The length of the sensory epithelium is significantly decreased in Myh10DN cochleae but the width is unchanged as a result of a significant increase in cell density. (F-K) The sensory epithelium in control and Myh10DN cochleae. (F) Fluorescent image of the sensory epithelium in the middle region of the cochlea from an E16 control embryo. Cell borders are labeled with phalloidin (green) and hair cells are marked with anti-myosin 6 (red). (G) Line drawing derived from the image in F, with cell types marked as follows: hair cells, blue; supporting cells, yellow; pillar cells, pink. (H) Comparable image to F, but from an Myh10DN cochlea. Note the decreased cell size and disrupted organization. (I) Line drawing as in G. Rather than a single row, multiple rows of pillar cells (pink) are present. (J,K) Sensory epithelium in the middle region of the cochlea from an E16 control (J) and an Myh10DN (K) embryo. Inner pillar cells are labeled with anti-p75NTR (red). A single row of inner pillar cells (arrow) is present in the control. Three additional p75NTR-positive cells are present adjacent to the developing inner pillar cell row (just above the arrow). By contrast, two rows of inner pillar cells are present in the mutant (arrows) and additional anti-p75NTR-positive cells (arrowheads) are located in the outer hair cell domain. Insets: line drawings of the inner pillar cells in J and K (not to scale). Scale bars: 200 μm in A,C; 10 μm in B,D,F (same magnification in J,H,K). *P<0.01, **P<0.02, ***P<0.05.
Fig. 5.
Fig. 5.
Inhibition of myosin II activity disrupts cochlear CE. (A) Outgrowth of the sensory epithelium was assayed by cutting the intact cochlear duct at its midpoint and then maintaining the basal piece in vitro. Over the subsequent 72-96 hours the sensory epithelium extended outwards from the cut end of the explant. (B) Control explant established as described in A. The site of the initial cut is marked in white. The sensory epithelium (hair cells marked in red) extends from the initial cut site. (C) Explant established as in B, but treated with 10 μM of the myosin II inhibitor blebbistatin beginning at E14. The sensory epithelium is noticeably shorter and wider. (D) An explant established as in B, but treated with 10 μM of the ROCK inhibitor Y27632. The phenotype of the sensory epithelium is similar to that in C. (E,F) Images of the sensory epithelium from control (E) and 10 μM blebbistatin-treated (F) explants labeled with anti-myosin 6 (red) and phalloidin (green). Additional inner pillar cells (PC) are present in blebbistatin-treated explants. Patterning in the IHCs and OHCs is also disrupted. Abbreviations as in Fig. 2. (G) Treatment with either blebbistatin or Y27632 results in a significant and dose-dependent decrease in extension of the sensory epithelium. By contrast, the skeletal muscle myosin inhibitor BTS did not affect extension. (H) Treatment with 10 μM blebbistatin leads to a significant increase in the width of the sensory epithelium. However, the width of the sensory epithelium was not significantly increased in explants treated with 10 μM Y27632. (I) Blebbistatin treatment leads to changes in cell shape that are consistent with changes in Myh10DN mutants. (J,K) Surface (upper panel) and cross-section (lower panel) views of control (J) and blebbistatin-treated (K) explants labeled with an antibody specific for the tight junction protein ZO1 (green). Tight junctions are present in explants from both conditions and are restricted to the lumenal surfaces. Scale bars: 50 μm in B (same magnification in C,D); 20 μm in E (same magnification in F,I,J). *P<0.005, **P<0.001, ***P<0.01.
Fig. 6.
Fig. 6.
Pillar cell shape is affected in blebbistatin-treated cochlear explants. (A) Low magnification view of a control explant established at E13 and fixed after 72 hours in vitro. The pillar cells (green) extend in a single line along the length of the explant. (B) Low magnification view of an explant established and labeled as in A, but treated with 10 μM blebbistatin for 48 hours beginning after 24 hours in vitro. The overall length of the epithelium is shorter and the row of pillar cells appears less organized. (C) High magnification view of the sensory epithelium from a control explant labeled as in A. The pillar cells are present in a single organized row. (D) The same view as in C with the red channel removed. Pillar cells are indicated (arrows). (E) High magnification view of the sensory epithelium from an explant treated with 10 μM blebbistatin, labeled as in A. (F) The same view as in E, with the red channel removed. Note the poor organization of the row of pillar cells and the more rounded shape. (G) Quantification of the average length and width of pillar cells in control and blebbistatin-treated explants. In blebbistatin-treated explants, pillar cell lengths are significantly shorter, whereas pillar cell widths are significantly greater, resulting in a significant decrease in the length/width ratio. Scale bars: 100 μm in A (same magnification in B); 20 μm in D (same magnification in C,E,F).
Fig. 7.
Fig. 7.
CE occurs autonomously within the sensory epithelium. (A,B) Control (A) and 10 μM blebbistatin (B) explants treated for 48 hours beginning at E14.5. Hair cells are labeled with anti-myosin 6, the sensory epithelium is shorter and wider in the blebbistatin-treated explant. (C,D) Lengths and widths for cochlear explants treated with 10 μM blebbistatin during the indicated time periods. Treatment beginning at E14.5 or E15.5 results in significant shortening and widening of the sensory epithelium. Treatment beginning at E17.5 results in a significant widening without a change in length. (E,F) Control (E) and 3 μM blebbistatin-treated (F) explants established without mesenchyme. The effects of blebbistatin are similar to those observed in explants with mesenchyme. (G,H) Effects of blebbistatin on the length and width of the sensory epithelium are comparable between explants with and without mesenchyme. Scale bar: 50 μm in A (same magnification in B,E,F). *P<0.05, **P<0.01, ***P<0.001.

References

    1. Amano, M., Ito, M., Kimura, K., Fukata, Y., Chihara, K., Nakano, T., Matsuura, Y. and Kaibuchi, K. (1996). Phosphorylation and activation of myosin by Rho-associated kinase (Rho-kinase). J. Biol. Chem. 271, 20246-20249. - PubMed
    1. Bertet, C., Sulak, L. and Lecuit, T. (2004). Myosin-dependent junction remodelling controls planar cell intercalation and axis elongation. Nature 429, 667-671. - PubMed
    1. Bessard, A., Coutant, A., Rescan, C., Ezan, F., Fremin, C., Courselaud, B., Ilyin, G. and Baffet, G. (2006). An MLCK-dependent window in late G1 controls S phase entry of proliferating rodent hepatocytes via ERK-p70S6K pathway. Hepatology 44, 152-163. - PubMed
    1. Bok, J., Dolson, D. K., Hill, P., Ruther, U., Epstein, D. J. and Wu, D. K. (2007). Opposing gradients of Gli repressor and activators mediate Shh signaling along the dorsoventral axis of the inner ear. Development 134, 1713-1722. - PubMed
    1. Campbell, C., Cucci, R. A., Prasad, S., Green, G. E., Edeal, J. B., Galer, C. E., Karniski, L. P., Sheffield, V. C. and Smith, R. J. (2001). Pendred syndrome, DFNB4, and PDS/SLC26A4 identification of eight novel mutations and possible genotype-phenotype correlations. Hum. Mutat. 17, 403-411. - PubMed

Publication types