. 2009 May 26;106(21):8635-40.
doi: 10.1073/pnas.0900621106. Epub 2009 May 13.

Human memory FOXP3+ Tregs secrete IL-17 ex vivo and constitutively express the T(H)17 lineage-specific transcription factor RORgamma t

Affiliations

Human memory FOXP3+ Tregs secrete IL-17 ex vivo and constitutively express the T(H)17 lineage-specific transcription factor RORgamma t

Maha Ayyoub et al. Proc Natl Acad Sci U S A. .

Abstract

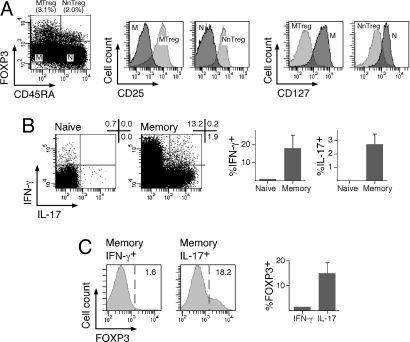
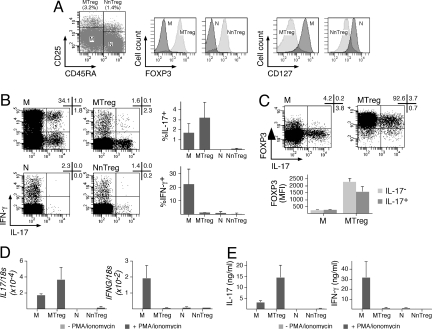
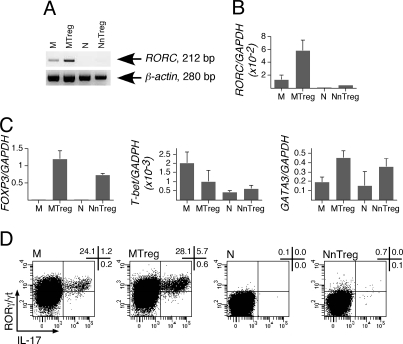
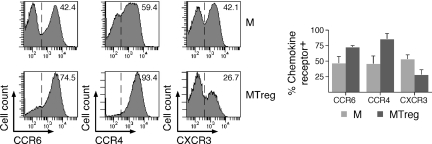
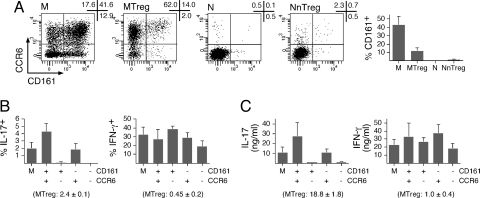
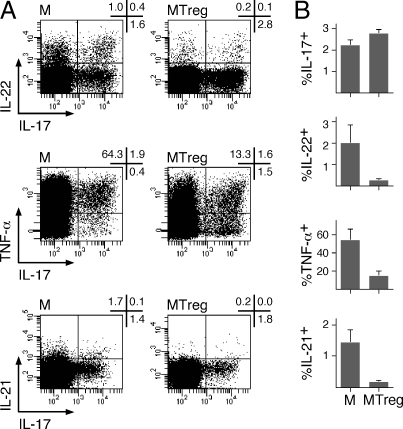
Recent studies have suggested a close relationship between CD4(+)FOXP3(+) regulatory T cells (Tregs) and proinflammatory IL-17-producing T helper cells (T(H)17) expressing the lineage-specific transcription factor RORgamma t. We report here the unexpected finding that human memory Tregs secrete IL-17 ex vivo and constitutively express RORgamma t. IL-17-secreting Tregs share some phenotypic and functional features with conventional T(H)17 cells, expressing high levels of CCR4 and CCR6 and low levels of CXCR3. However, unlike conventional T(H)17 cells, they express low levels of CD161 and mostly fail to cosecrete IL-22 and TNF-alpha ex vivo. Ex vivo secretion of IL-17 and constitutive expression of RORgamma t by human memory Tregs suggest that, in addition to their well-known suppressive functions, these cells likely play additional, as yet undescribed, proinflammatory functions.


Conflict of interest statement

The authors declare no conflict of interest.

Figures

Fig. 1.
Fig. 1.
A fraction of CD4+ T cells producing IL-17 ex vivo express FOXP3. (A) CD4+ T cells isolated from PBMCs of healthy donors were stained with anti-FOXP3, anti-CD25, anti-CD45RA, and anti-CD127 antibodies and analyzed by flow cytometry. Expression of FOXP3 and CD45RA defines memory (M; FOXP3CD45RA) and naïve (N; FOXP3CD45RA+) conventional CD4+ T cells and memory (MTreg; FOXP3+CD45RA) and naïve (NnTreg; FOXP3+CD45RA+) Tregs. Histograms show the expression of CD25 and CD127 gated on the defined CD4+ T cell populations. Results are shown for 1 of 3 donors. (B and C) Enriched CD4+ T cells were stimulated for 6 h with PMA/ionomycin and stained with antibodies specific for CD45RA, FOXP3, IL-17, and IFN-γ. (B) The proportion of IL-17-secreting and IFN-γ-secreting cells is shown gated on total naïve (CD45RA+) and memory (CD45RA) CD4+ T cells. Dot plots for 1 donor and data for 3 donors are shown (mean ± SD). (C) The proportion of FOXP3-expressing cells is shown gated on IL-17-secreting and IFN-γ-secreting cells as indicated. Histograms for 1 donor and data for 3 donors are shown (mean ± SD).
Fig. 2.
Fig. 2.
Human FOXP3+ MTregs secrete IL-17 ex vivo. (A) Enriched CD4+ T cells were stained with anti-CD8, anti-CD25, and anti-CD45RA antibodies, and CD8 cells were separated by flow cytometry cell sorting into memory (M; CD25CD45RA) and naïve (N; CD25CD45RA+) conventional CD4+ T cells and memory (MTreg; CD25+CD45RA) and naïve (NnTreg; CD25+CD45RA+) Tregs (dot plot). A fraction of sorted populations was stained with anti-FOXP3 and anti-CD127 antibodies and analyzed by flow cytometry (histograms). Results are shown for 1 of 3 donors. (B) The fraction of IL-17-secreting and IFN-γ-secreting cells among sorted CD4+ T cell populations (M, MTreg, N, and NnTreg) was determined by intracellular cytokine staining and flow cytometry analysis after 6 h of stimulation with PMA/ionomycin. Dot plots for 1 donor and data for 3 donors are shown (mean ± SD). (C) Sorted M and MTreg cells were stimulated for 6 h with PMA/ionomycin and stained with anti-FOXP3 and anti-IL-17 antibodies and analyzed by flow cytometry. Dot plots for 1 of 3 donors are shown (Upper). Mean fluorescence intensity (MFI) of FOXP3 staining in IL-17+ and IL-17 cells is shown for 3 donors (mean ± SD; Lower). (D and E) Sorted CD4+ T cell populations were stimulated for 24 h in the absence or presence of PMA/ionomycin, and IL17 and IFNG mRNA levels were determined by quantitative PCR (D), and the quantity of IL-17 and IFN-γ secreted in the culture supernatant was measured by ELISA (E). Data are shown for 3 donors (mean ± SD).
Fig. 3.
Fig. 3.
Ex vivo expression of RORγt by MTregs. (A and B) CD4+ T cells were separated by flow cytometry as in Fig. 2A, and RORC mRNA expression in sorted populations was assessed by conventional (A) and quantitative (B) PCR. (C) FOXP3, T-bet, and GATA3 mRNA expression was determined in sorted CD4+ T cell populations by quantitative PCR. (D) RORγ/γt expression and IL-17 production by sorted populations were assessed by intracellular staining using specific antibodies after 6 h of stimulation with PMA/ionomycin. Results are shown for 1 of 3 donors.
Fig. 4.
Fig. 4.
CD4+ T cells were stained with antibodies specific for CD25 and CD45RA as well as for CCR4, CCR6, or CXCR3. Chemokine receptor expression was analyzed gated on CD25CD45RA (M) and CD25+CD45RA (MTreg) cells. Histograms for 1 donor and data for 3 donors are shown (mean ± SD).
Fig. 5.
Fig. 5.
Low proportions of MTregs express CD161. (A) CD4+ T cells were stained with antibodies specific for CD25, CD45RA, CCR6, and CD161. Dot plots from 1 donor are shown gated on the indicated population defined as in Fig. 2A. Data for 3 donors are shown (mean ± SD). (B and C) CD4+ T cells were stained with anti-CD25, anti-CD45RA, anti-CCR6, and anti-CD161 antibodies, and conventional memory cells (CD25CD45RA) were sorted by flow cytometry either as 1 population or separated into 4 populations according to the expression of CCR6 and CD161. Sorted populations were stimulated, and cytokine production was assessed as in Fig. 2B (B) and Fig. 2E (C) (mean ± SD, n = 2).
Fig. 6.
Fig. 6.
Cytokine production by IL-17-producing MTregs. M and MTreg populations were sorted by flow cytometry as in Fig. 2A, and IL-17 and IL-22, TNF-α, or IL-21 production was determined by intracellular cytokine staining after 6 h of stimulation with PMA/ionomycin. Dot plots for 1 donor (A) and data for 3 donors (B; mean ± SD) are shown.

References

    1. Murphy KM, Reiner SL. The lineage decisions of helper T cells. Nat Rev Immunol. 2002;2:933–944. - PubMed
    1. Mosmann TR, Coffman RL. TH1 and TH2 cells: Different patterns of lymphokine secretion lead to different functional properties. Annu Rev Immunol. 1989;7:145–173. - PubMed
    1. Hori S, Nomura T, Sakaguchi S. Control of regulatory T cell development by the transcription factor Foxp3. Science. 2003;299:1057–1061. - PubMed
    1. Fontenot JD, Gavin MA, Rudensky AY. Foxp3 programs the development and function of CD4+CD25+ regulatory T cells. Nat Immunol. 2003;4:330–336. - PubMed
    1. Sakaguchi S, Sakaguchi N, Asano M, Itoh M, Toda M. Immunologic self-tolerance maintained by activated T cells expressing IL-2 receptor alpha-chains (CD25). Breakdown of a single mechanism of self-tolerance causes various autoimmune diseases. J Immunol. 1995;155:1151–1164. - PubMed

Publication types

MeSH terms

Substances