. 2009;4(5):e5550.
doi: 10.1371/journal.pone.0005550. Epub 2009 May 14.

The abdominal circulatory pump

Affiliations

The abdominal circulatory pump

Andrea Aliverti et al. PLoS One. 2009.

Abstract

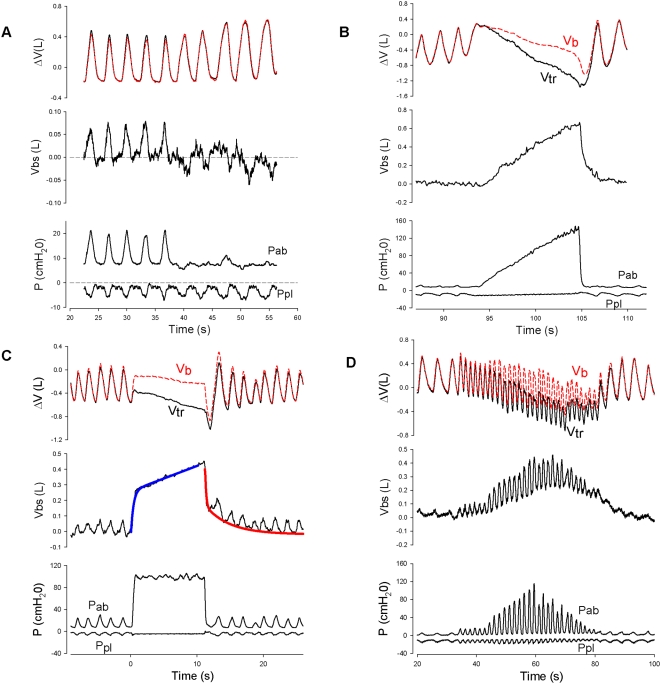
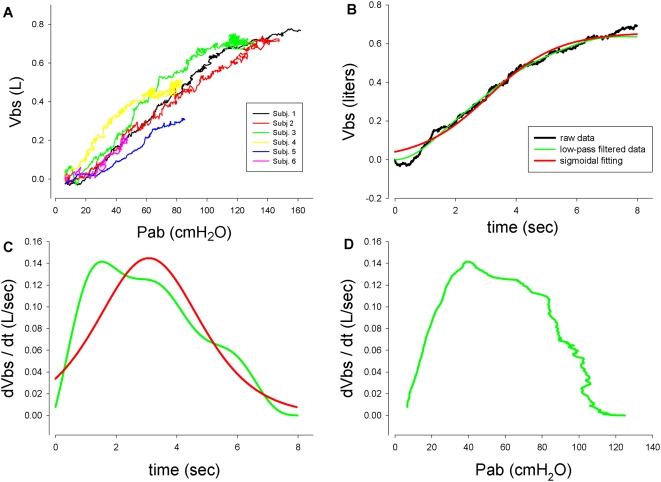
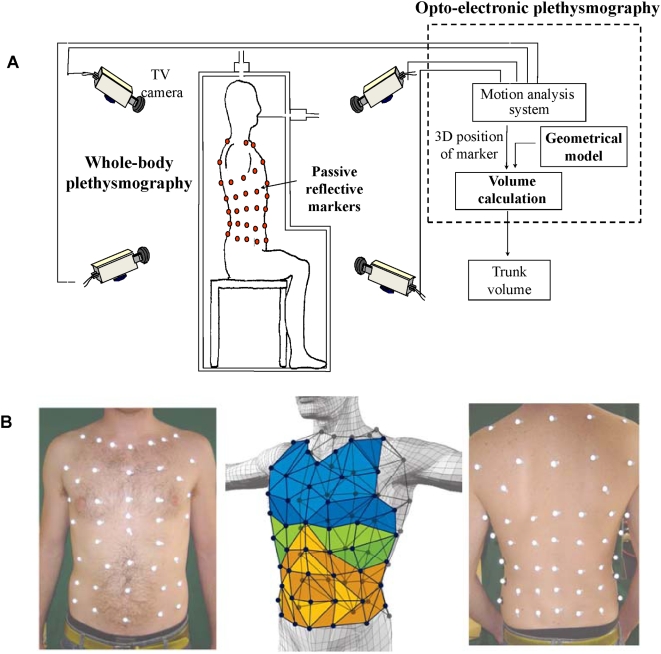
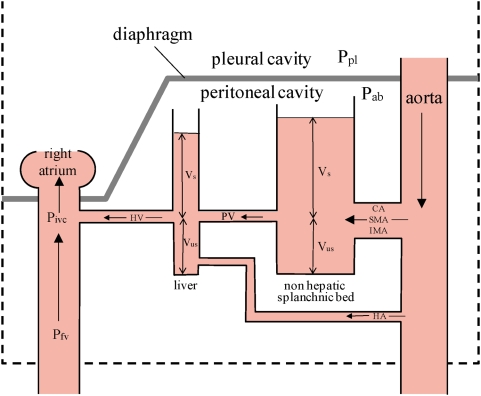
Blood in the splanchnic vasculature can be transferred to the extremities. We quantified such blood shifts in normal subjects by measuring trunk volume by optoelectronic plethysmography, simultaneously with changes in body volume by whole body plethysmography during contractions of the diaphragm and abdominal muscles. Trunk volume changes with blood shifts, but body volume does not so that the blood volume shifted between trunk and extremities (Vbs) is the difference between changes in trunk and body volume. This is so because both trunk and body volume change identically with breathing and gas expansion or compression. During tidal breathing Vbs was 50-75 ml with an ejection fraction of 4-6% and an output of 750-1500 ml/min. Step increases in abdominal pressure resulted in rapid emptying presumably from the liver with a time constant of 0.61+/-0.1SE sec. followed by slower flow from non-hepatic viscera. The filling time constant was 0.57+/-0.09SE sec. Splanchnic emptying shifted up to 650 ml blood. With emptying, the increased hepatic vein flow increases the blood pressure at its entry into the inferior vena cava (IVC) and abolishes the pressure gradient producing flow between the femoral vein and the IVC inducing blood pooling in the legs. The findings are important for exercise because the larger the Vbs the greater the perfusion of locomotor muscles. During asystolic cardiac arrest we calculate that appropriate timing of abdominal compression could produce an output of 6 L/min. so that the abdominal circulatory pump might act as an auxiliary heart.


Conflict of interest statement

Competing Interests: A. Aliverti, R. Dellaca, A. Pedotti and P.T. Macklem have applied for a patent to protect the intellectual property for the technology described in the paper, but apart from that none of the authors has a commercial, personal or professional interest that could be, or perceived to be a conflict of interest with the material described in the manuscript.

Figures

Figure 1
Figure 1. Recordings of pressures and volumes during respiratory maneuvers.
1-A. Tracings during spontaneous quiet breathing and minimization of inspiratory increases in abdominal pressure (Pab). Top tracings: changes in body volume (Vb, red dashed line) and the volume of the trunk (Vtr, black solid line) measured simultaneously showing the ventilatory pattern. The difference between Vb and Vtr gives the volume of blood shifted from the splanchnic vascular bed to the extremities (Vbs) shown in the middle tracing. Blood shifts (60–75 ml) from the splanchnic bed are in phase with ΔPab during spontaneous breathing but when ΔPab was minimized, the blood shifts abruptly changed both phase and magnitude. Bottom traces: abdominal pressure (Pab) and pleural pressure (Ppl). 1-B. Simultaneous recordings of Vb (red dashed line) and Vtr (black solid line) (top tracings) during a ramp increase in Pab while Ppl remained unchanged (bottom tracings). The volume of blood shifted from the splanchnic vascular bed to the extremities (Vbs) is shown in the middle tracing. 1-C. Effect of a step increase in Pab (bottom trace) on Vbs shown in the top and middle traces. There was an initial rapid shift in blood probably from the liver followed by a slower one probably from the non-hepatic splanchnic vasculature. We were able to fit the emptying curve with a double exponential shown by the blue solid line. Refilling was modeled as a single exponential (red solid line). From these exponentials time constants for filling and emptying were calculated (table 1). 1-D. Tracings during rapid breathing with progressive breath-by-breath increases in Pab followed by progressive decreases as shown in the bottom traces. During the period of rapid breathing there were equally rapid blood shifts coming from the fast compartment. As the amplitude of the Pga swings increased, blood shifts of ∼350 ml came from the slow space. This space refilled as the amplitude of the Pga swings decreased. Strong and sustained increases in Pga can transfer a significant fraction of the splanchnic blood reservoir to perfuse locomotor muscles and other body tissues in a physiologic form of blood doping.
Figure 2
Figure 2. Pressure, volume and flow relationships.
2-A. Volume of blood shifts during ramp increases in Pab in all subjects. Each colour represents a single subject. 2-B. A representative tracing of Vbs during a ramp maneuver as a function of time showing a typical sigmoid shape. The red line superimposed on the raw data results from low-pass filtering and the green line from curve fitting with a sigmoid. 2-C. Flow from the splanchnic bed (dVbs/dt) obtained by differentiating the green and red lines. Both curves indicate that flow increases, reaches a maximum and then decreases nearly to zero. 2-D. The Pab-flow curve shows an initially rapidly increasing flow, a maximum and then a decrease as Pab increases, falling to zero at high Pab. This is explained by the mechanics of fluid flow in a collapsible tube described in the text.
Figure 3
Figure 3. Experimental set-up.
3-A Schematic diagram of the experimental set-up used to measure Vbs as the difference between changes in body volume and trunk volume (ΔVb-ΔVtr). ΔVb and ΔVtr are measured simultaneously by whole body plethysmography and Opto-electronic plethysmography (OEP), respectively. OEP is based on a motion analysis system which measures the 3D positions of 89 reflective markers positioned on body surface by a set of TV cameras, and computes the volume of the trunk by Gauss's Theorem. 3-B Marker positions on the anterior (left photograph) and posterior (right photograph) trunk surface. In the middle figure a diagram of the thoraco-abdominal surface triangulation is shown.
Figure 4
Figure 4. Hydraulic model of the splanchnic vascular bed, consisting of two capacitors, the liver vasculature and the non-hepatic splanchnic vascular bed.
CA = celiac artery; SMA = superior mesenteric artery; IMA = inferior mesenteric artery; HA = hepatic artery; Vs = stressed volume of blod where vascular transmural pressure >0; Vus = unstressed volume where vascular transmural pressure <0; Ppl = pleural pressure; Pab = abdominal pressure; PV = portal vein; HV = hepatic vein; Pfv = pressure in the femoral vein; Pivc = pressure in the inferior vena cava at the entry of the hepatic vein. The height of the column of blood indicates that there is a pressure gradient from aorta > mean vascular pressure in the non hepatic vessels > mean vascular pressure in the hepatic vascular bed > right atrial pressure.
Figure 5
Figure 5. Electrical analogue of the circulatory system powered by two generators the cardiac pump (C) and the abdominal circulatory pump (A).
Arrows indicate direction of blood flow. AA = aortic arch; DA = descending aorta; CA = celiac artery; SMA = superior mesenteric artery; IMA = inferior mesenteric artery; HA = hepatic artery; PV = portal vein; HV = hepatic vein; SVC = superior vena cava; IVC = inferior vena cava; FV = femoral vein; Pab = abdominal pressure; Pivc = pressure in the IVC at the point where the hepatic vein enters; Cup = compliance of capacitance vessels in the head and upper extremities; Clo = compliance of the capacitance vessels in the urinary and reproductive systems, the adrenal glands and the lower extremities; Csp = compliance of capacitance vessels in the splanchnic circulation, divided into two component compliances: Chep = compliance of the hepatic capacitance vessels and; Cnon-hep = compliance of the capacitance vessels of the non-hepatic abdominal viscera including stomach, intestines, spleen and pancreas. The generator C includes both left and right heart, the lungs and pulmonary circulation. For further description, see text.
Figure 6
Figure 6. Electrical analogue of asystolic cardiac arrest
. The symbols are the same as in figure 5 with the addition of RH = right heart; LH = left heart, both of which are now represented by diodes, and PC = pulmonary circulation. Diodes in the femoral vein and superior vena cava represent venous valves that ensure that blood entering the inferior vena cava flows through the heart and pulmonary circulation into the aorta. For further description, see text.
Figure 7
Figure 7. Relationship between splanchnic outflow and splanchnic blood volume following a step increase in Pab lasting for ∼10 sec.
in four male subjects. Each line pattern represents a different subject. In all subjects there is initial, exponential emptying of a fast compartment, with a steep and linear slope equal to the rate constant of emptying, followed by a slower compartment and a longer rate constant.
Figure 8
Figure 8. Photograph of a subject inside the transparent whole body plethysmograph with body surface markers for optoelectronic plethysmography in place.
The cameras recording motion of the anterior markers are shown in the background.
Figure 9
Figure 9. Frequency response of the variable flow whole body plethysmograph.
Blue line is the box alone; green line is the antifilter alone; red line is the box and antifilter combined.

References

    1. Iandelli I, Aliverti A, Kayser B, Dellacà R, Cala SJ, et al. Determinants of exercise performance in normal men with externally imposed expiratory flow limitation. J Appl Physiol. 2002;92:1943–1952. - PubMed
    1. Cala SJ, Kenyon CM, Ferrigno G, Carnevali P, Aliverti A, et al. Chest wall and lung volume estimation by optical reflectance motion analysis. J.Appl.Physiol. 1996;81:2680–2689. - PubMed
    1. Aliverti A, Dellacà RL, Lotti P, Bertini S, Duranti R, et al. Influence of expiratory flow-limitation during exercise on systemic oxygen delivery in humans. Eur J Appl Physiol. 2005;95:229–242. - PubMed
    1. Criley JM, Blaufuss AH, Kissel GL. Cough-induced cardiac compression. Self-administered from of cardiopulmonary resuscitation. JAMA. 1976;236:1246–1250. - PubMed
    1. Niemann JT, Rosborough J, Hausknecht M, Brown D, Criley JM. Cough-CPR: Documentation of systemic perfusion in man and in an experimental model: a “window” to the mechanism of blood flow in external CPR. Crit Care Med. 1980;8:141–146. - PubMed

Publication types