. 2009;4(5):e5555.
doi: 10.1371/journal.pone.0005555. Epub 2009 May 18.

Exploring functional beta-cell heterogeneity in vivo using PSA-NCAM as a specific marker

Affiliations

Exploring functional beta-cell heterogeneity in vivo using PSA-NCAM as a specific marker

Melis Karaca et al. PLoS One. 2009.

Abstract

Background: The mass of pancreatic beta-cells varies according to increases in insulin demand. It is hypothesized that functionally heterogeneous beta-cell subpopulations take part in this process. Here we characterized two functionally distinct groups of beta-cells and investigated their physiological relevance in increased insulin demand conditions in rats.

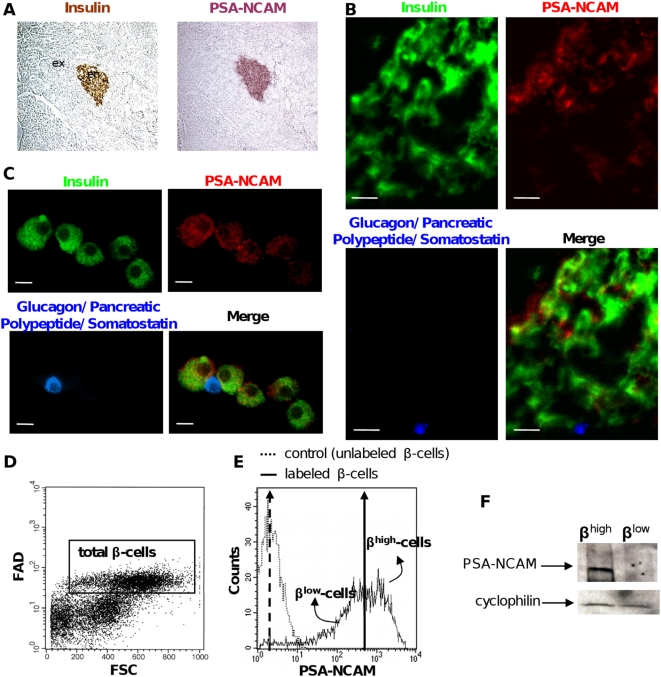
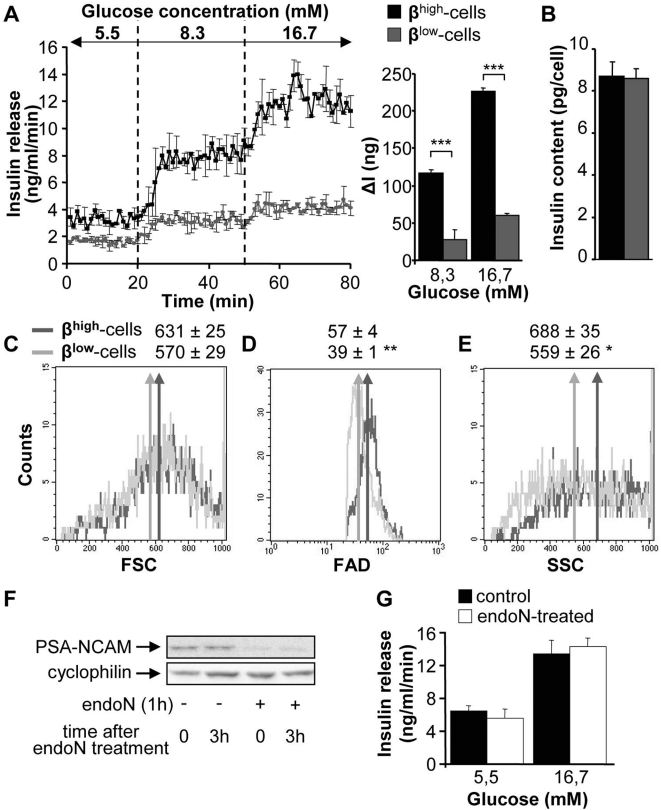
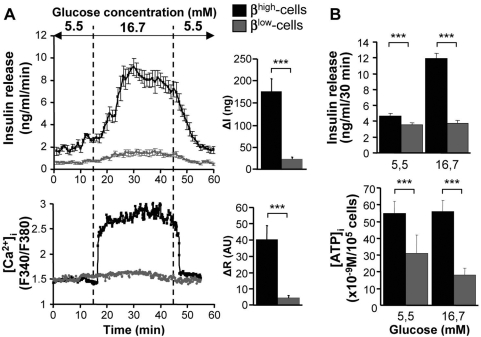
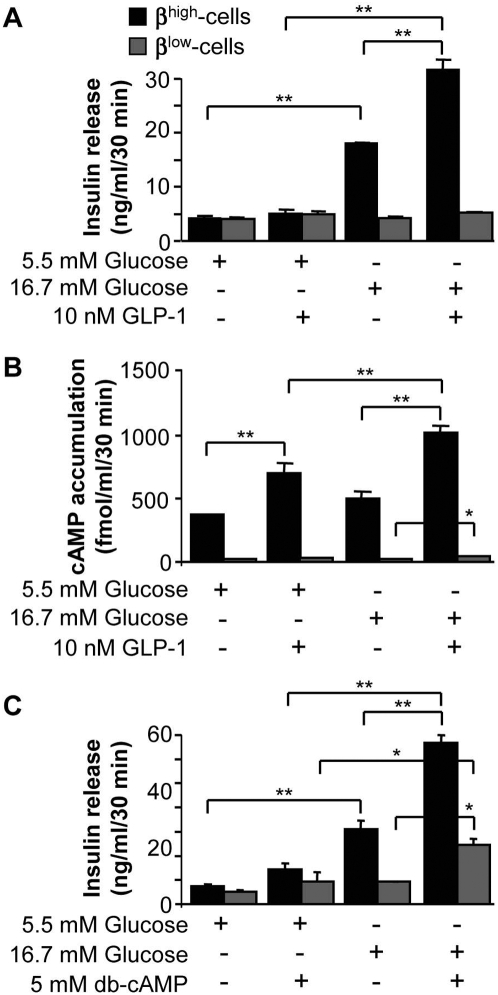
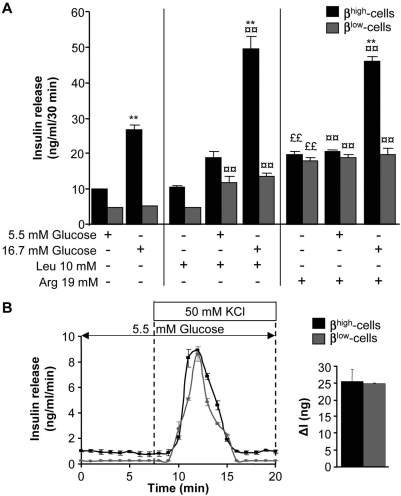
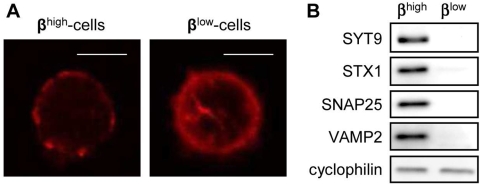
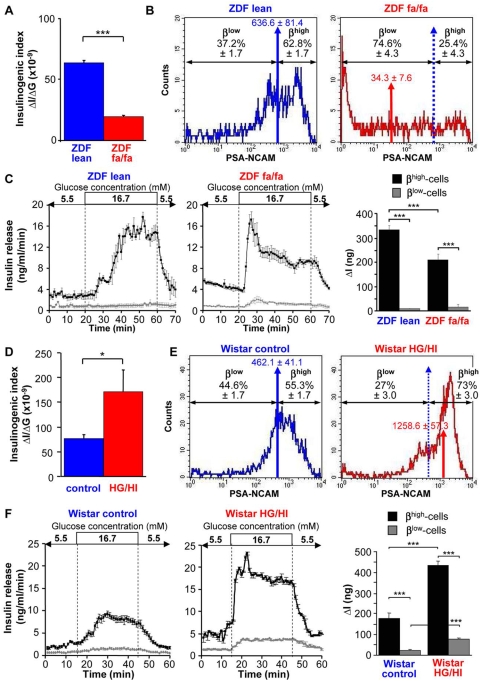
Methods: Two rat beta-cell populations were sorted by FACS according to their PSA-NCAM surface expression, i.e. beta(high) and beta(low)-cells. Insulin release, Ca(2+) movements, ATP and cAMP contents in response to various secretagogues were analyzed. Gene expression profiles and exocytosis machinery were also investigated. In a second part, beta(high) and beta(low)-cell distribution and functionality were investigated in animal models with decreased or increased beta-cell function: the Zucker Diabetic Fatty rat and the 48 h glucose-infused rat.

Results: We show that beta-cells are heterogeneous for PSA-NCAM in rat pancreas. Unlike beta(low)-cells, beta(high)-cells express functional beta-cell markers and are highly responsive to various insulin secretagogues. Whereas beta(low)-cells represent the main population in diabetic pancreas, an increase in beta(high)-cells is associated with gain of function that follows sustained glucose overload.

Conclusion: Our data show that a functional heterogeneity of beta-cells, assessed by PSA-NCAM surface expression, exists in vivo. These findings pinpoint new target populations involved in endocrine pancreas plasticity and in beta-cell defects in type 2 diabetes.


Conflict of interest statement

Competing Interests: Manuel Brun, Anne Geant, Sandra Catesson, Marianne Rodriguez, Brian Lockhart, Alain Ktorza and Catherine Kargar are employees of Servier.

Figures

Figure 1
Figure 1. Pancreatic β-cells are heterogeneous for PSA-NCAM.
(A) Immunochemical analyses on successive frozen rat pancreas sections stained for insulin (brown) and PSA-NCAM (purple). ex: exocrine tissue ; en: endocrine tissue. (B) Frozen rat pancreas. In islets, PSA-NCAM (red) colocalizes only with insulin (green) and not with other islet hormones (blue). Scale bar: 30 µm. (C) Dissociated islet cells. PSA-NCAM (red) colocalizes only with insulin (green) and not with other islet hormones (blue). Scale bar: 10 µm. (D) Representative dot plot analysis of dissociated islet cells examined for their FAD content and cell size (FSC) in order to gate total β-cells (black frame). (E) Representative histogram of PSA-NCAM surface labeling of total β-cells. Vertical arrows indicate the geometric mean (481±27 for labeled β-cells). This value was used to arbitrarily separate and sort highly (βhigh) and poorly (βlow) PSA-NCAM labeled β-cells (n = 7). (F) Immunoblot analysis for total PSA-NCAM expression. Cyclophilin was used as loading control.
Figure 2
Figure 2. βlow-cells are poorly responsive to glucose.
(A) Insulin release in response to 5.5 mM, 8.3 mM and 16.7 mM glucose in βhigh and βlow cells determined by perifusion experiments (n = 2). Quantification of insulin response to stimulating glucose is represented by ΔI. (B) Insulin content (n = 3). (C–E) Representative histogram of size (FSC) (C), FAD (autofluorescence) (D) and granularity (SSC) (E) of sorted βhigh and βlow-cells (n = 5–7). (F) Immunoblot analysis for PSA-NCAM expression after endoneuraminidase N (endoN) treatment (0.7 U/ml) of βhigh-cells. Cyclophilin was used as loading control. (G) Insulin release in response to 5.5 mM and 16.7 mM glucose in endoN-treated βhigh-cells (0.7 U/ml) assessed by static incubation experiments (n = 2). n represents the number of independent cell preparations from 6 pooled rats each. Data are means±SEM. *, p<0.05; **, p<0.01; ***, p<0.005.
Figure 3
Figure 3. βlow-cells exhibit altered Ca2+ and ATP signaling in response to glucose.
(A) Insulin release (top panel) and cytoplasmic calcium concentration ([Ca2+]i) oscillations (bottom panel) in response to 5.5 mM and 16.7 mM glucose in βhigh and βlow-cells during perifusion experiments (n = 3–6). Quantification of insulin and calcium responses to stimulating glucose are represented by ΔI and ΔR respectively. (B) Insulin release (top panel) and intracellular ATP ([ATP]) levels (bottom panel) in response to 5.5 mM and 16.7 mM glucose in βhigh and βlow cells assessed by static incubation experiments (n = 2). n represents the number of independent cell preparations from 6 pooled rats each. Data are means±SEM. ***, p<0.005.
Figure 4
Figure 4. βlow-cells have an altered cAMP signaling.
Effects of 5.5 mM and 16.7 mM glucose±10 nM GLP-1 on insulin release (A) and cAMP content (B) in βhigh and βlow-cells assessed by static incubation experiments (n = 3–5). (C) Effects of 5.5 mM and 16.7 mM glucose±5 mM db-cAMP on insulin secretion in βhigh and βlow-cells (n = 3–5). n represents the number of independent cell preparations from 6 pooled rats each. Data are means±SEM. *, p<0.05 and **, p<0.01.
Figure 5
Figure 5. βhigh and βlow-cells respond equally to depolarizing agents but differently to metabolizable secretagogues.
(A) Effects of 5.5 mM and 16.7 mM glucose±10 mM leucine (Leu) or 19 mM arginine (Arg) on insulin release in βhigh and βlow-cells (n = 3–5). Data are means±SEM. *, p<0.05 and **, p<0.01 for stimulating conditions (16.7 mM glucose±Arg or Leu) compared to basal conditions (5.5 mM glucose±Arg or Leu). ¤, p<0.05 and ¤¤, p<0.01 between treated (glucose+Arg or Leu) and non-treated conditions (glucose alone) for same glucose concentrations. ££, p<0.01 for Arg or Leu alone compared to 5.5 mM glucose alone. (B) Insulin secretory response to 5.5 mM glucose±50 mM KCl in βhigh and βlow-cells (n = 3–5). Quantification of insulin response to KCl is represented by ΔI. Data are means±SEM. *, p<0.05 between βhigh and βlow-cells. n represents the number of independent cell preparations from 6 pooled rats each.
Figure 6
Figure 6. The exocytosis machinery of βlow-cells is not favorable to GSIS.
(A) Representative pictures of actin filament distribution in βhigh and βlow-cells. Scale bar: 10 µm (B) Representative immunoblots of exocytotic proteins in βhigh and βlow-cells (n = 3). n represents the number of independent cell preparations from at least 6 pooled rats each.
Figure 7
Figure 7. The change in βhigh to βlow-cell ratio correlates with the change in β-cell function in animal models with increased insulin demand.
(A) Insulinogenic index (ΔI/ΔG) after OGTT in ZDF fa/fa rats compared to ZDF lean controls (12 rats). (B) Representative FACS analyses of dissociated islet cells in type 2 diabetic ZDF rat, a model of loss of β-cell function. The geometric mean of PSA-NCAM fluorescence is represented by a blue arrow in control ZDF lean rats and by a red arrow in diabetic ZDF fa/fa rats. The distribution of βhigh and βlow-cells is determined by the geometric mean of PSA-NCAM of the control ZDF lean rats (blue arrows) and expressed in percent of total β-cells (n = 3–6). (C) Insulin release in response to 5.5 mM and 16.7 mM glucose in βhigh and βlow-cells of ZDF rats during perifusion experiments (n = 3–6). Quantification of insulin response to stimulating glucose is represented by ΔI. (D) Insulinogenic index (ΔI/ΔG) after OGTT in HG/HI rats compared to saline-infused controls (Wistar control). (E) Representative FACS analyses of dissociated islet cells in HG/HI rats and Wistar control rats. The geometric mean of PSA-NCAM fluorescence is represented by a blue arrow in saline-infused Wistar control rats and by a red arrow in HG/HI rats. The distribution of βhigh and βlow-cells is determined by the geometric mean of PSA-NCAM of the control Wistar rats (blue arrows) and expressed in percent of total β-cells (n = 3–6). (F) Insulin release in response to 5.5 mM and 16.7 mM glucose in βhigh and βlow-cells of control and HG/HI rats during perifusion experiments (n = 3–6). Quantification of insulin response to stimulating glucose is represented by ΔI. n represents the number of independent cell preparations from at least 6 rats pooled each. Data are means±SEM. *, p<0.05; ***, p<0.005.

References

    1. Prentki M, Nolan CJ. Islet beta cell failure in type 2 diabetes. J Clin Invest. 2006;116:1802–1812. - PMC - PubMed
    1. Ahrén B, Thorsson O. Increased insulin sensitivity is associated with reduced insulin and glucagon secretion and increased insulin clearance in man. J Clin Endocrinol Metab. 2003;88:1264–1270. - PubMed
    1. Parsons JA, Brelje TC, Sorenson RL. Adaptation of islets of Langerhans to pregnancy: increased islet cell proliferation and insulin secretion correlates with the onset of placental lactogen secretion. Endocrinology. 1992;130:1459–1466. - PubMed
    1. Klöppel G, Löhr M, Habich K, Oberholzer M, Heitz PU. Islet pathology and the pathogenesis of type 1 and type 2 diabetes mellitus revisited. Surv Synth Pathol Res. 1985;4:110–125. - PubMed
    1. Van Schravendijk CF, Kiekens R, Pipeleers DG. Pancreatic beta cell heterogeneity in glucose-induced insulin secretion. J Biol Chem. 1992;267:21344–21348. - PubMed

Publication types

MeSH terms