

Treatment of patients with new onset Type 1 diabetes with a single course of anti-CD3 mAb Teplizumab preserves insulin production for up to 5 years
- PMID: 19443276
- PMCID: PMC2735402
- DOI: 10.1016/j.clim.2009.04.007
Treatment of patients with new onset Type 1 diabetes with a single course of anti-CD3 mAb Teplizumab preserves insulin production for up to 5 years
Abstract
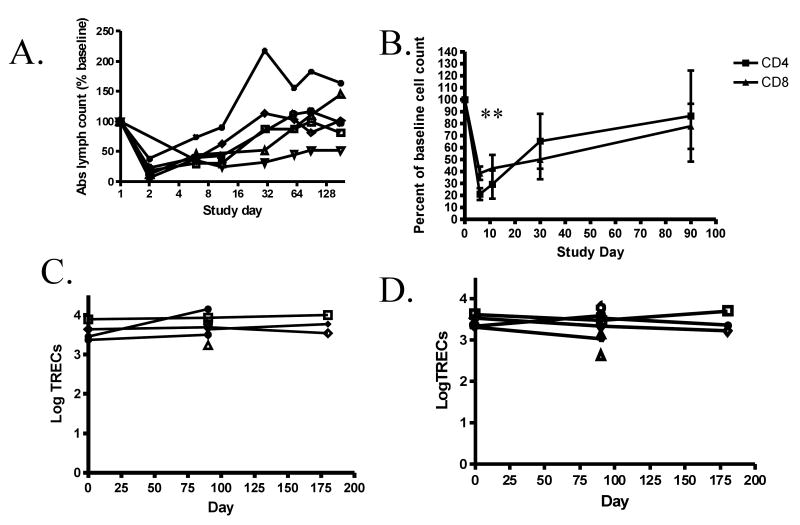
Anti-CD3 mAbs may prolong beta cell function up to 2 years in patients with new onset Type 1 diabetes (T1DM). A randomized open label trial of anti-CD3 mAb, Teplizumab, in T1DM was stopped after 10 subjects because of increased adverse events than in a previous trial related with higher dosing of drug. Teplizumab caused transient reduction in circulating T cells, but the recovered cells were not new thymic emigrants because T cell receptor excision circles were not increased. There was a trend for reduced loss of C-peptide over 2 years with drug treatment (p=0.1), and insulin use was lower (p<0.001). In 4 drug-treated subjects followed up to 60 months, C-peptide responses were maintained. We conclude that increased doses of Teplizumab are associated with greater adverse events without improved efficacy. The drug may marginate rather than deplete T cells. C-peptide levels may remain detectable up to 5 years after treatment.
Figures


References
-
- Herold KC, Gitelman SE, Masharani U, Hagopian W, Bisikirska B, Donaldson D, Rother K, Diamond B, Harlan DM, Bluestone JA. A Single Course of Anti-CD3 Monoclonal Antibody hOKT3{gamma}1(Ala-Ala) Results in Improvement in C-Peptide Responses and Clinical Parameters for at Least 2 Years after Onset of Type 1 Diabetes. Diabetes. 2005;54:1763–9. - PMC - PubMed
-
- Herold KC, Hagopian W, Auger JA, Poumian-Ruiz E, Taylor L, Donaldson D, Gitelman SE, Harlan DM, Xu D, Zivin RA, Bluestone JA. Anti-CD3 monoclonal antibody in new-onset type 1 diabetes mellitus. N Engl J Med. 2002;346:1692–8. - PubMed
-
- Keymeulen B, Vandemeulebroucke E, Ziegler AG, Mathieu C, Kaufman L, Hale G, Gorus F, Goldman M, Walter M, Candon S, Schandene L, Crenier L, De Block C, Seigneurin JM, De Pauw P, Pierard D, Weets I, Rebello P, Bird P, Berrie E, Frewin M, Waldmann H, Bach JF, Pipeleers D, Chatenoud L. Insulin needs after CD3-antibody therapy in new-onset type 1 diabetes. N Engl J Med. 2005;352:2598–608. - PubMed
-
- Belghith M, Bluestone JA, Barriot S, Megret J, Bach JF, Chatenoud L. TGF-beta-dependent mechanisms mediate restoration of self-tolerance induced by antibodies to CD3 in overt autoimmune diabetes. Nat Med. 2003;9:1202–8. - PubMed
Publication types
MeSH terms
Substances
Grants and funding
LinkOut - more resources
Full Text Sources
Other Literature Sources
Medical
