INTREPID: a web server for prediction of functionally important residues by evolutionary analysis
- PMID: 19443452
- PMCID: PMC2703888
- DOI: 10.1093/nar/gkp339
INTREPID: a web server for prediction of functionally important residues by evolutionary analysis
Abstract
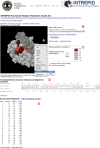
We present the INTREPID web server for predicting functionally important residues in proteins. INTREPID has been shown to boost the recall and precision of catalytic residue prediction over other sequence-based methods and can be used to identify other types of functional residues. The web server takes an input protein sequence, gathers homologs, constructs a multiple sequence alignment and phylogenetic tree and finally runs the INTREPID method to assign a score to each position. Residues predicted to be functionally important are displayed on homologous 3D structures (where available), highlighting spatial patterns of conservation at various significance thresholds. The INTREPID web server is available at http://phylogenomics.berkeley.edu/intrepid.
Figures


Similar articles
-
INTREPID--INformation-theoretic TREe traversal for Protein functional site IDentification.Bioinformatics. 2008 Nov 1;24(21):2445-52. doi: 10.1093/bioinformatics/btn474. Epub 2008 Sep 6. Bioinformatics. 2008. PMID: 18776193 Free PMC article.
-
firestar--prediction of functionally important residues using structural templates and alignment reliability.Nucleic Acids Res. 2007 Jul;35(Web Server issue):W573-7. doi: 10.1093/nar/gkm297. Epub 2007 Jun 21. Nucleic Acids Res. 2007. PMID: 17584799 Free PMC article.
-
Berkeley Phylogenomics Group web servers: resources for structural phylogenomic analysis.Nucleic Acids Res. 2007 Jul;35(Web Server issue):W27-32. doi: 10.1093/nar/gkm325. Epub 2007 May 8. Nucleic Acids Res. 2007. PMID: 17488835 Free PMC article.
-
The trRosetta server for fast and accurate protein structure prediction.Nat Protoc. 2021 Dec;16(12):5634-5651. doi: 10.1038/s41596-021-00628-9. Epub 2021 Nov 10. Nat Protoc. 2021. PMID: 34759384 Review.
-
Comparison of proteins based on segments structural similarity.Acta Biochim Pol. 2004;51(1):161-72. Acta Biochim Pol. 2004. PMID: 15094837 Review.
Cited by
-
Common and distant structural characteristics of feruloyl esterase families from Aspergillus oryzae.PLoS One. 2012;7(6):e39473. doi: 10.1371/journal.pone.0039473. Epub 2012 Jun 22. PLoS One. 2012. PMID: 22745763 Free PMC article.
-
Tradeoff between stability and multispecificity in the design of promiscuous proteins.PLoS Comput Biol. 2009 Dec;5(12):e1000627. doi: 10.1371/journal.pcbi.1000627. Epub 2009 Dec 24. PLoS Comput Biol. 2009. PMID: 20041208 Free PMC article.
-
Protein function annotation with Structurally Aligned Local Sites of Activity (SALSAs).BMC Bioinformatics. 2013;14 Suppl 3(Suppl 3):S13. doi: 10.1186/1471-2105-14-S3-S13. Epub 2013 Feb 28. BMC Bioinformatics. 2013. PMID: 23514271 Free PMC article.
-
Proteins and Their Interacting Partners: An Introduction to Protein-Ligand Binding Site Prediction Methods.Int J Mol Sci. 2015 Dec 15;16(12):29829-42. doi: 10.3390/ijms161226202. Int J Mol Sci. 2015. PMID: 26694353 Free PMC article. Review.
-
Probing remote residues important for catalysis in Escherichia coli ornithine transcarbamoylase.PLoS One. 2020 Feb 6;15(2):e0228487. doi: 10.1371/journal.pone.0228487. eCollection 2020. PLoS One. 2020. PMID: 32027716 Free PMC article.
References
-
- Glaser F, Pupko T, Paz I, Bell RE, Bechor-Shental D, Martz E, Ben-Tal N. ConSurf: identification of functional regions in proteins by surface-mapping of phylogenetic information. Bioinformatics. 2003;19:163–164. - PubMed
-
- Mihalek I, Res I, Lichtarge O. A family of evolution-entropy hybrid methods for ranking protein residues by importance. J. Mol. Biol. 2004;336:1265–1282. - PubMed
-
- Capra JA, Singh M. Predicting functionally important residues from sequence conservation. Bioinformatics. 2007;23:1875–1882. - PubMed

