. 2009 Aug;23(8):1231-41.
doi: 10.1210/me.2008-0304. Epub 2009 May 14.

Kinetic and thermodynamic characterization of dihydrotestosterone-induced conformational perturbations in androgen receptor ligand-binding domain

Affiliations

Kinetic and thermodynamic characterization of dihydrotestosterone-induced conformational perturbations in androgen receptor ligand-binding domain

Ravi Jasuja et al. Mol Endocrinol. 2009 Aug.

Abstract

Ligand-induced conformational perturbations in androgen receptor (AR) are important in coactivator recruitment and transactivation. However, molecular rearrangements in AR ligand-binding domain (AR-LBD) associated with agonist binding and their kinetic and thermodynamic parameters are poorly understood. We used steady-state second-derivative absorption and emission spectroscopy, pressure and temperature perturbations, and 4,4'-bis-anilinonaphthalene 8-sulfonate (bis-ANS) partitioning to determine the kinetics and thermodynamics of the conformational changes in AR-LBD after dihydrotestosterone (DHT) binding. In presence of DHT, the second-derivative absorption spectrum showed a red shift and a change in peak-to-peak distance. Emission intensity increased upon DHT binding, and center of spectral mass was blue shifted, denoting conformational changes resulting in more hydrophobic environment for tyrosines and tryptophans within a more compact DHT-bound receptor. In pressure perturbation calorimetry, DHT-induced energetic stabilization increased the Gibbs free energy of unfolding to 8.4 +/- 1.3 kcal/mol from 3.5 +/- 1.6 kcal/mol. Bis-ANS partitioning studies revealed that upon DHT binding, AR-LBD underwent biphasic rearrangement with a high activation energy (13.4 kcal/mol). An initial, molten globule-like burst phase (k approximately 30 sec(-1)) with greater solvent accessibility was followed by rearrangement (k approximately 0.01 sec(-1)), leading to a more compact conformation than apo-AR-LBD. Molecular simulations demonstrated unique sensitivity of tyrosine and tryptophan residues during pressure unfolding with rearrangement of residues in the coactivator recruitment surfaces distant from the ligand-binding pocket. In conclusion, DHT binding leads to energetic stabilization of AR-LBD domain and substantial rearrangement of residues distant from the ligand-binding pocket. DHT binding to AR-LBD involves biphasic receptor rearrangement including population of a molten globule-like intermediate state.


Figures

Figure 1
Figure 1
Second-derivative absorption spectra of AR-LBD were derived in the absence and presence of DHT. A, Absolute absorption spectra; B, difference spectra in the UV region. The peak to trough distance between the maximum at 278 and the maximum at 273 nm is indicated as α, and the peak to trough distance between the maximum at 287 and minimum at 282 nm is indicated as β.
Figure 2
Figure 2
Effect of DHT binding and GnHCl denaturation of AR-LBD on the emission spectra of intrinsic tyrosine and tryptophan residues. Fifty nanomolar AR-LBD (2 mm DTT in 50 mm Tris-HCl) was excited at 278 nm and data were collected from 300–450 nm through a 1-nm slit. Inset, Difference spectra after addition of DHT (solid line) or 4 m GnHCl (dashed line) to elucidate the changes in emission peak and intensity of AR-LBD.
Figure 3
Figure 3
Perrin plots of fluorescein-labeled testosterone (FA) bound to AR-LBD and free FA in solution. The steady-state anisotropy of 4 or 8 nm FA in the absence (○) and presence (•) of 50 nm LBD was obtained at different glycerol concentrations [to vary the viscosity (η)] at 20, 30, and 40 C.
Figure 4
Figure 4
Pressure-induced denaturation of AR-LBD in the absence (A and B) or presence (C and D) of DHT. Data collected at 22.5 C are shown. B and D on the right display the difference spectra and highlight the change in intensity and red shift in the CM with increasing pressures (from 0–300 MPa). The emission spectra were collected in solutions containing 25 nm AR-LBD and 0.5 μm DHT in 50 mm Tris, 2 mm DTT. The samples were excited at λex of 278 nm and emission collected from 300–450 nm through a 1-nm slit for excitation and emission monochromators.
Figure 5
Figure 5
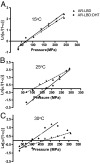
Fits of the extent of unfolding as a function of increasing pressure to evaluate free energy and volume changes in the absence and presence of DHT. Data for λex at 278 nm are shown. α denotes the fraction of the protein unfolded at each pressure. A–C, Data and fits for unfolding at 15, 25, and 30 C, respectively. Gibbs free energy (ΔG) and molar volume (ΔV) changes associated with unfolding of free and DHT-bound AR-LBD are summarized in Table 1.
Figure 6
Figure 6
A, Effect of pressure on the polarization of FA with and without AR-LBD. FA (2 nm) was incubated with 25 nm AR-LBD in 50 mm Tris and 2 mm DTT for 1 h before the pressure titration. The experiments were conducted at 22 C, and the solution was allowed to equilibrate at each pressure for 5 min before data acquisition. B, Difference between the polarization of FA with and without AR-LBD at each point during pressurization. ΔmP is the corresponding difference in two polarization measurements.
Figure 7
Figure 7
Effect of AR-LBD with and without DHT on the emission properties of nonselective probe bis-ANS. Bis-ANS (10 μm) was incubated with 50 nm AR-LBD with or without saturating concentrations of DHT (1 μm). λex was set at 395 nm, and emission was collected from 430–610 nm.
Figure 8
Figure 8
Concentration and temperature dependence of DHT-induced conformational changes in the AR-LBD. A, Fluorescence transients from mixing 5 nm AR-LBD with 100 μm DHT and the single exponential fits to the data, The top trace (a) was taken at 10 C, and the bottom trace (b) was taken at 20 C (kobs = 15.6 ± 0.5 and 24.5 ± 0.8 sec−1, respectively). The inset shows the slow decrease observed over a 100-sec time scale after subtracting the buffer control (kobs = 0.01 ± 0.001 sec−1). B, Independence of the rate constants on DHT concentration for the initial faster component examined at 22.5 C. C, Arrhenius plots that demonstrate the temperature dependence of the initial faster component and the linear fit of the data that was used to determine the Arrhenius activation energy. Error bars represent se of the fits at each temperature.
Figure 9
Figure 9
Molecular dynamics simulations of the AR-LBD at a temperature of 295.5 K and atmospheric pressure. A and B, Superimposed cartoon representations of AR-LBD in the ligand-bound form and apo-form, respectively. Pink coloring represents initial structures, and pale green coloring represents structures after 10 nsec of simulations. C, AR-LBD apo-form colored by the difference between sd of residue RMSDs for LBD-R1881 complex and apo-form (i.e. by changes in residue mobilities upon ligand unbinding) over a 6- to 10-nsec time interval. Positive values correspond to greater mobility in the apo-form. D, Predicted RMSDs for LBI, CoaRS1, CoaRS2, and CoaBC. Red curves show RMSDs of helices in a ligand-bound structure, whereas green curves show them in an apo-form structure. The groups of residues are defined as follows: LBI (V685, L701, N705, L707, Q711, L744, M745, M749, R752, Y763, F764, Q783, M787, F876, T 877, L880, F891, and M895), CoaRS1 (V713, V730, and M734), CoaRS2 (E709, L712, V713, V715, V716, K717, K720, F725, R726, V730, Q733, M734, I737, and Q738), CoaBC (helices 3, 3′, 4, 5, and 12), and non-CoaBC (helices 1, 6, 7, 8, 9, 10, and 11).

Similar articles

Cited by

References

    1. Quigley CA, De Bellis A, Marschke KB, el-Awady MK, Wilson EM, French FS 1995 Androgen receptor defects: historical, clinical, and molecular perspectives. Endocr Rev [Erratum (1995) 16:546] 16:271–321 - PubMed
    1. Brinkmann AO, Klaasen P, Kuiper GG, van der Korput JA, Bolt J, de Boer W, Smit A, Faber PW, van Rooij HC, Geurts van Kessel A, Mulder E, Trapman J 1989 Structure and function of the androgen receptor. Urol Res 17:87–93 - PubMed
    1. Gobinet J, Poujol N, Sultan Ch 2002 Molecular action of androgens. Mol Cell Endocrinol 198:15–24 - PubMed
    1. Bhasin S, Cunningham GR, Hayes FJ, Matsumoto AM, Snyder PJ, Swerdloff RS, Montori VM 2006 Testosterone therapy in adult men with androgen deficiency syndromes: an endocrine society clinical practice guideline. J Clin Endocrinol Metab 91:1995–2010 - PubMed
    1. Bhasin S 2007 Testicular disorders. In: Kronenberg H, Polonsky KS, Larsen PR, Melmed S, eds. Williams’ textbook of endocrinology. 11th ed. New York: Elsevier Health Sciences

Publication types