Clinical Trial
. 2009 Sep 3;114(10):2068-76.
doi: 10.1182/blood-2009-03-213280. Epub 2009 May 14.

F18-fluorodeoxyglucose positron emission tomography in the context of other imaging techniques and prognostic factors in multiple myeloma

Affiliations
Clinical Trial

F18-fluorodeoxyglucose positron emission tomography in the context of other imaging techniques and prognostic factors in multiple myeloma

Twyla B Bartel et al. Blood. .

Abstract

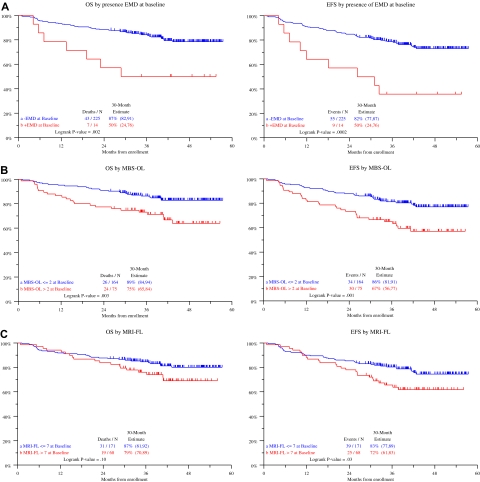
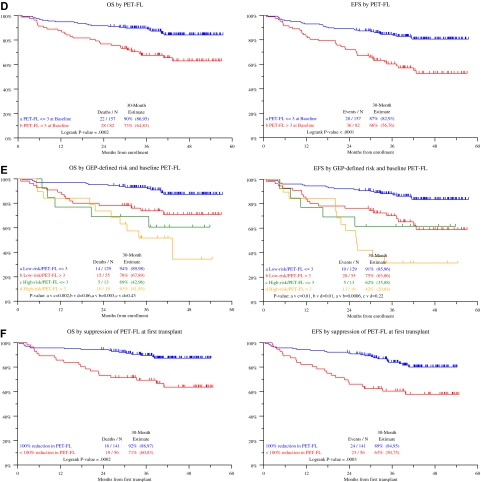
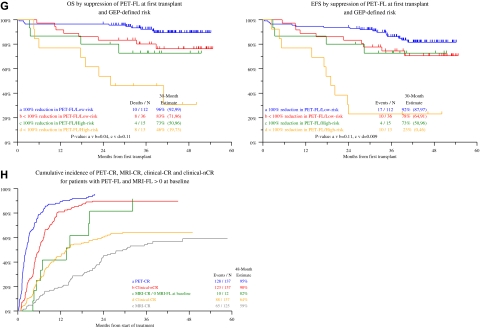
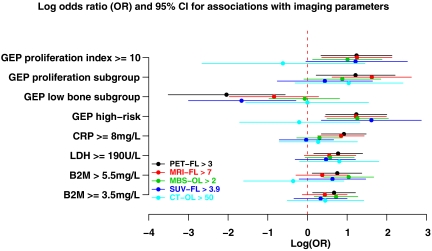
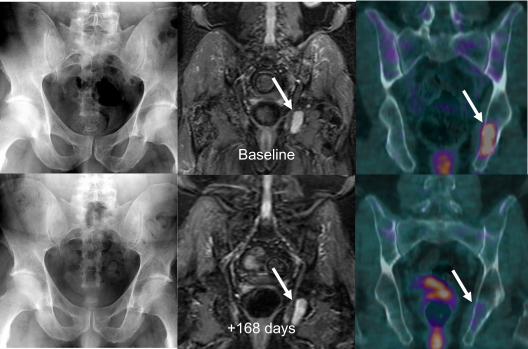
F18-fluorodeoxyglucose positron emission tomography (FDG-PET) is a powerful tool to investigate the role of tumor metabolic activity and its suppression by therapy for cancer survival. As part of Total Therapy 3 for newly diagnosed multiple myeloma, metastatic bone survey, magnetic resonance imaging, and FDG-PET scanning were evaluated in 239 untreated patients. All 3 imaging techniques showed correlations with prognostically relevant baseline parameters: the number of focal lesions (FLs), especially when FDG-avid by PET-computed tomography, was positively linked to high levels of beta-2-microglobulin, C-reactive protein, and lactate dehydrogenase; among gene expression profiling parameters, high-risk and proliferation-related parameters were positively and low-bone-disease molecular subtype inversely correlated with FL. The presence of more than 3 FDG-avid FLs, related to fundamental features of myeloma biology and genomics, was the leading independent parameter associated with inferior overall and event-free survival. Complete FDG suppression in FL before first transplantation conferred significantly better outcomes and was only opposed by gene expression profiling-defined high-risk status, which together accounted for approximately 50% of survival variability (R(2) test). Our results provide a rationale for testing the hypothesis that myeloma survival can be improved by altering treatment in patients in whom FDG suppression cannot be achieved after induction therapy.


Figures

Figure 1
Figure 1
Overall survival and event-free survival and cumulative incidence of complete or near-complete response. (A-E) Overall survival and event-free survival outcomes according to imaging parameters (MBS-OL, MRI-FL, PET-FL, SUV-FL, EMD [cut-points based on tertile distributions and collapsing categories with similar outcomes]): Both overall and event-free survival durations were significantly shorter in the presence of EMD detected on PET examination (A), higher osteolytic lesion number enumerated on metastatic bone survey (MBS-OL; B), and higher focal lesion number on PET (PET-FL; D). Magnetic resonance imaging–defined focal lesions (MRI-FL) conferred inferior event-free survival and a trend toward inferior overall survival (C). Among the overall favorable GEP-defined low-risk group, PET-FL more than 3 identified a subset with inferior outcomes (E). (F-G) Survival outcomes according to complete FDG suppression (100%) before first transplantation: Complete FDG suppression at the end of 2 induction chemotherapy cycles before first transplantation conferred favorable overall and event-free survival (F), which was particularly important for the subset of patients presenting with GEP-defined high-risk features (G). (H) Time course to complete or near-complete response (CR, n-CR; defined by myeloma-protein and bone marrow criteria) and to imaging-defined complete response (resolution of focal lesions on MRI [MRI-CR] and PET [PET-CR], normalization of bone marrow intensity to hypointensity status in patients without MRI-FL): PET-CR status was attained more rapidly than clinical CR or n-CR and especially MRI-CR status among patients presenting with MRI-FL.
Figure 1
Figure 1
Overall survival and event-free survival and cumulative incidence of complete or near-complete response. (A-E) Overall survival and event-free survival outcomes according to imaging parameters (MBS-OL, MRI-FL, PET-FL, SUV-FL, EMD [cut-points based on tertile distributions and collapsing categories with similar outcomes]): Both overall and event-free survival durations were significantly shorter in the presence of EMD detected on PET examination (A), higher osteolytic lesion number enumerated on metastatic bone survey (MBS-OL; B), and higher focal lesion number on PET (PET-FL; D). Magnetic resonance imaging–defined focal lesions (MRI-FL) conferred inferior event-free survival and a trend toward inferior overall survival (C). Among the overall favorable GEP-defined low-risk group, PET-FL more than 3 identified a subset with inferior outcomes (E). (F-G) Survival outcomes according to complete FDG suppression (100%) before first transplantation: Complete FDG suppression at the end of 2 induction chemotherapy cycles before first transplantation conferred favorable overall and event-free survival (F), which was particularly important for the subset of patients presenting with GEP-defined high-risk features (G). (H) Time course to complete or near-complete response (CR, n-CR; defined by myeloma-protein and bone marrow criteria) and to imaging-defined complete response (resolution of focal lesions on MRI [MRI-CR] and PET [PET-CR], normalization of bone marrow intensity to hypointensity status in patients without MRI-FL): PET-CR status was attained more rapidly than clinical CR or n-CR and especially MRI-CR status among patients presenting with MRI-FL.
Figure 2
Figure 2
Odds ratio of association of imaging parameters with baseline laboratory and imaging features. Plotted are the log odds ratio values with 95% confidence interval values for 5 imaging parameters (PET-FL, FDG-avid focal lesion number; MRI-FL, MRI-defined focal lesion number, MBS-OL, metastatic bone survey-defined osteolytic lesion number; SUV-FL, maximum standardized uptake values at bone marrow focal lesion sites; CT-OL, computed tomography–defined osteolytic lesion number). Significant correlations were observed for most imaging parameters with B2M, LDH, and several GEP-derived parameters such as high-risk, LB disease and proliferation (PR) subgroups, and proliferation index (PI).
Figure 3
Figure 3
Untreated myeloma patient with time-concordant MBS, MRI, and FDG-PET/CT studies. Baseline imaging studies (top row) showed no osteolysis on MBS (top left), several foci on STIR-weighted MRI images with the largest in the left ischium (top middle), and 2 foci on FDG-PET/CT imaging (top right) with the largest again in the left ischium with a maximum SUV of 4.1. The patient was in near-complete remission 168 days later, with a significant decrease in focal activity in the left ischial lesion on PET (bottom right).

Comment in

  • A new pet for myeloma.
    Dimopoulos MA, Moulopoulos LA, Terpos E. Dimopoulos MA, et al. Blood. 2009 Sep 3;114(10):2007-8. doi: 10.1182/blood-2009-06-224196. Blood. 2009. PMID: 19729530

References

    1. Dimopoulos MA, Moulopoulos LA, Datseris I, et al. Imaging of myeloma bone disease. Acta Oncol. 2000;39:823–827. - PubMed
    1. Lecouvet FE, Van de Berg BC, Malghem J, et al. Magnetic resonance and computed tomography imaging in multiple myeloma. Semin Musculoskelet Radiol. 2001;5:43–55. - PubMed
    1. Moulopoulos LA, Varma DG, Dimopoulos MA. Multiple myeloma: spinal MR imaging in patients with untreated newly diagnosed disease. Radiology. 1992;185:833–840. - PubMed
    1. Roodman G. Mechanisms of bone metastasis. N Engl J Med. 2004;350:1655–1664. - PubMed
    1. Yaccoby S, Pearse RN, Johnson CL, et al. Myeloma interacts with the bone marrow microenvironment to induce osteoclastogenesis and is dependent on osteoclast activity. Br J Haematol. 2002;116:278–290. - PubMed

Publication types

MeSH terms