

Comparison of clinical and spectral domain optical coherence tomography optic disc margin anatomy
- PMID: 19443718
- PMCID: PMC2751811
- DOI: 10.1167/iovs.09-3586
Comparison of clinical and spectral domain optical coherence tomography optic disc margin anatomy
Abstract
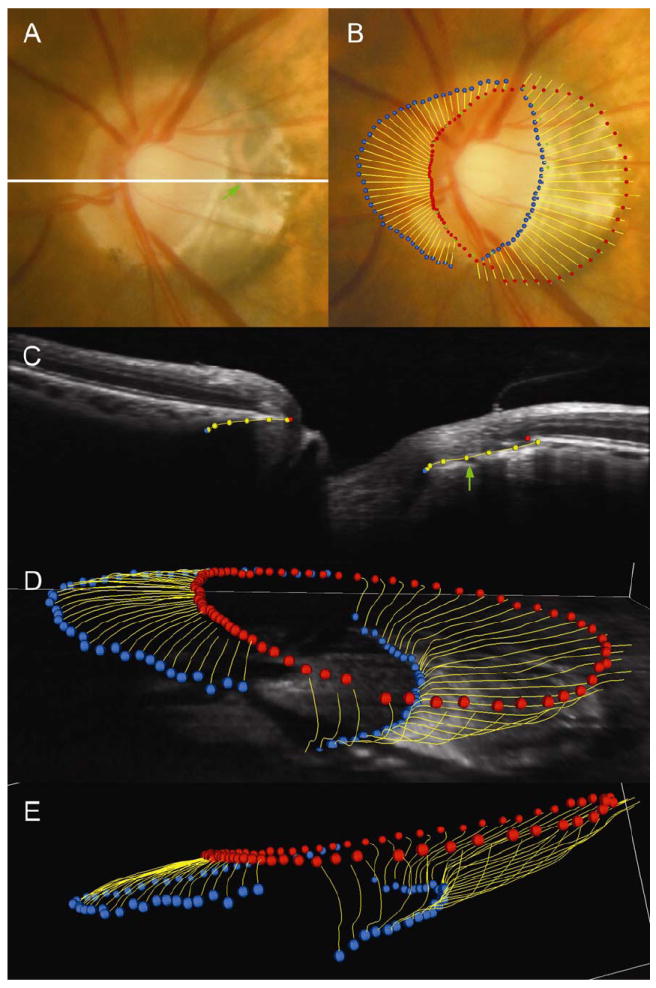
Purpose: To investigate spectral domain optical coherence tomography (SD-OCT)-detected optic disc margin anatomy in the monkey eye by colocalizing disc photographs to SD-OCT scans acquired from the same eyes.
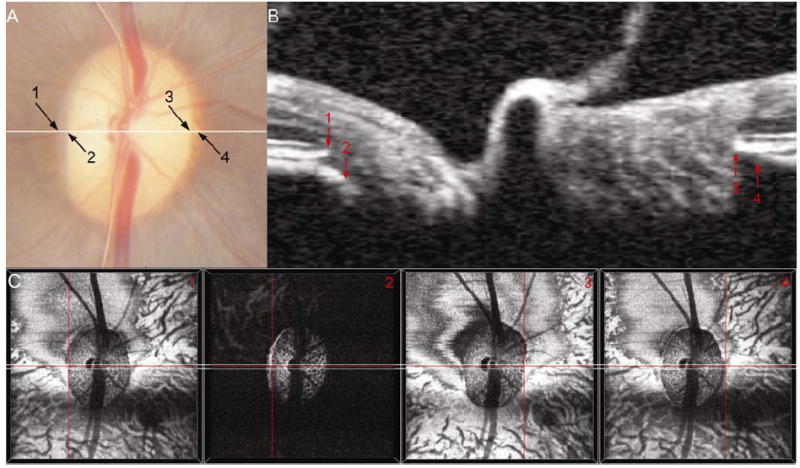
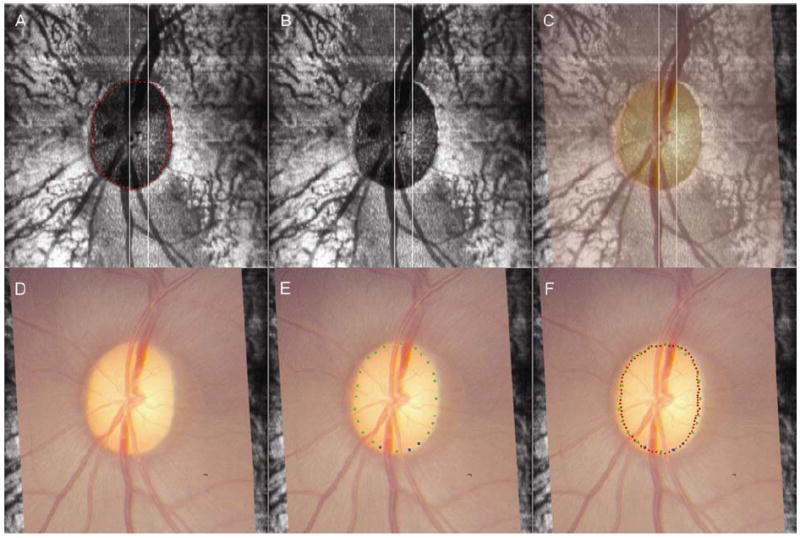
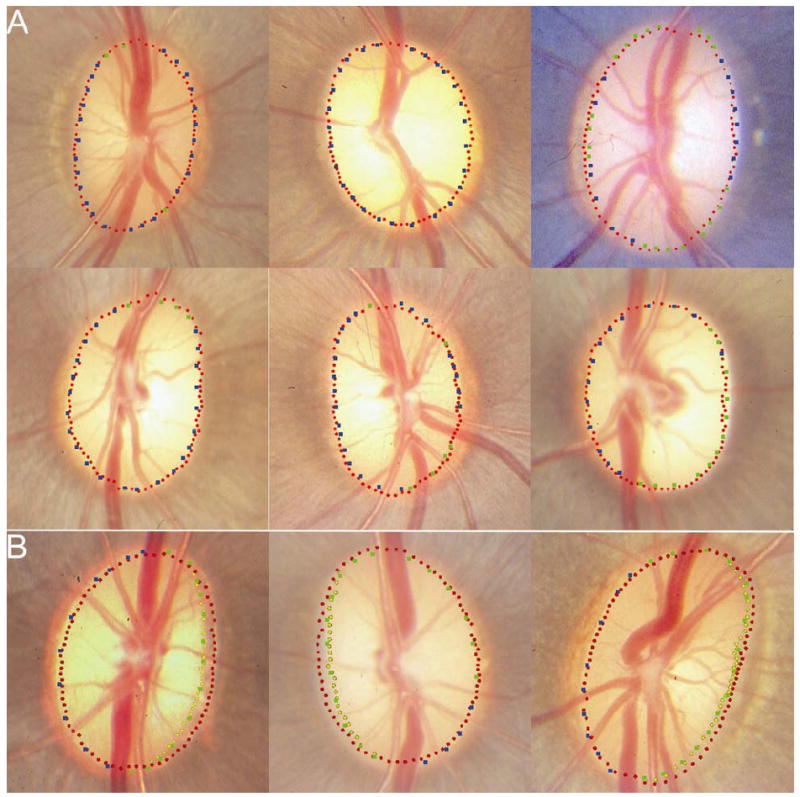
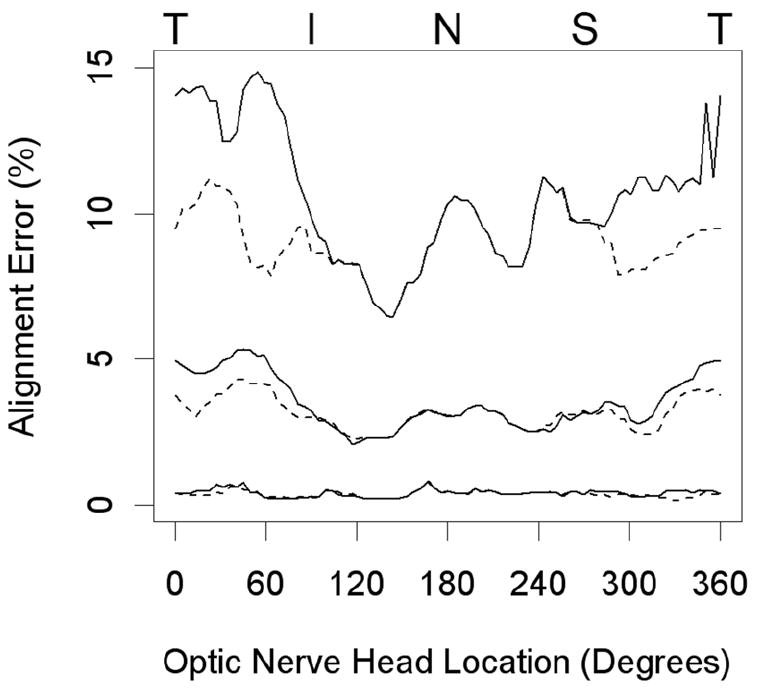
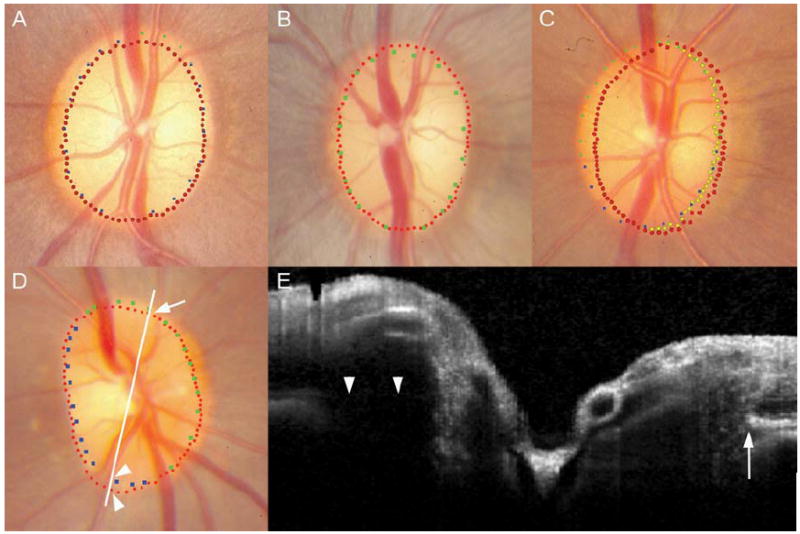
Methods: The neural canal opening (NCO) was delineated within 40 digital radial sections generated from SD-OCT volumes acquired from 33 normal monkey eyes (15 degrees, 290 x 768 horizontal grid pattern). Each volume was colocalized to its disc photograph by matching the retinal vessels within each photograph to vessel outlines visible within en face SD-OCT images. Border tissue was delineated where it extended internally to the NCO. A clinician (masked to delineated points) marked the disc margin onto each photograph while viewing the relevant stereophotograph pair. Alignment of the clinician-ascribed disc margin to the NCO and border tissue delineation was assessed. The process was repeated in a single myopic human eye.
Results: In 23 eyes, the NCO aligned to the disc margin. In 10 eyes, externally oblique border tissue was detectable in the temporal disc. In these regions of the disc, the termination of border tissue was the disc margin. An exaggerated form of this phenotype was observed in the myopic human eye. In this case, temporal border tissue terminated at the anterior scleral canal opening, which was detected as the disc margin.
Conclusions: The termination of Bruch's membrane, border tissue, and the anterior scleral canal opening may constitute the disc margin within the same eye, depending on the border tissue architecture; this anatomy is consistently visualized by SD-OCT.
Figures
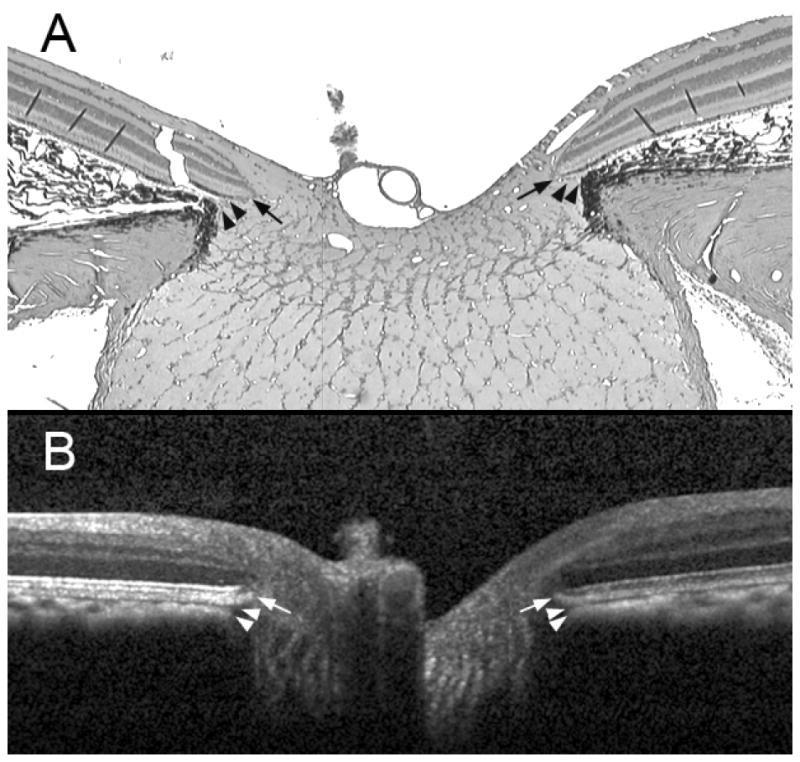
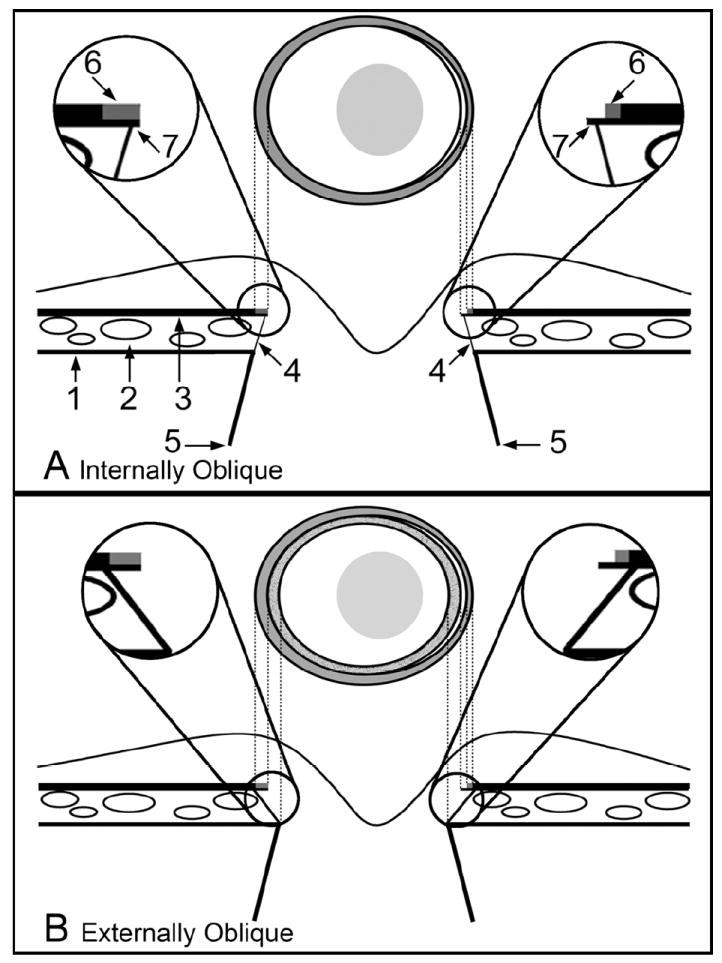
1 = Sclera
2 = Choriocapillaris
3 = Retinal pigment epithelium with Bruch’s Membrane
4 = Border Tissue
5 = Neural canal boundary
6 = Pigment on the surface of Bruch’s Membrane
7 = Bruch’s Membrane
References
-
- Jonas JB, Airaksinen PJ, Robert Y. Definitionsentwurf der intra- und parapapillären Parameter für die Biomorphometrie des Nervus opticus. Klin Monatsbl Augenheilkd. 1988;192:621.
-
- Anderson DR, Hoyt WF. Ultrastructure of intraorbital portion of human and monkey optic nerve. Arch Ophthalmol. 1969;82:506–530. - PubMed
-
- Fantes FE, Anderson DR. Clinical histologic correlation of human peripapillary anatomy. Ophthalmology. 1989;96:20–25. - PubMed
-
- Nevarez J, Rockwood EJ, Anderson DR. The configuration of peripapillary tissue in unilateral glaucoma. Arch Ophthalmol. 1988;106:901–903. - PubMed
-
- Burgoyne CF, Downs JC, Bellezza AJ, Hart RT. Three-dimensional reconstruction of normal and early glaucoma monkey optic nerve head connective tissues. Invest Ophthalmol Vis Sci. 2004;45:4388–4399. - PubMed
Publication types
MeSH terms
Grants and funding
LinkOut - more resources
Full Text Sources
Other Literature Sources
Research Materials
