. 2009 Jun 26;324(5935):1720-3.
doi: 10.1126/science.1162327. Epub 2009 May 14.

Diversity and complexity in DNA recognition by transcription factors

Affiliations

Diversity and complexity in DNA recognition by transcription factors

Gwenael Badis et al. Science. .

Abstract

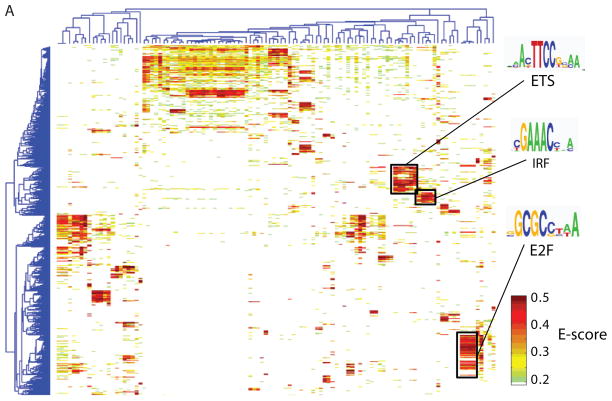
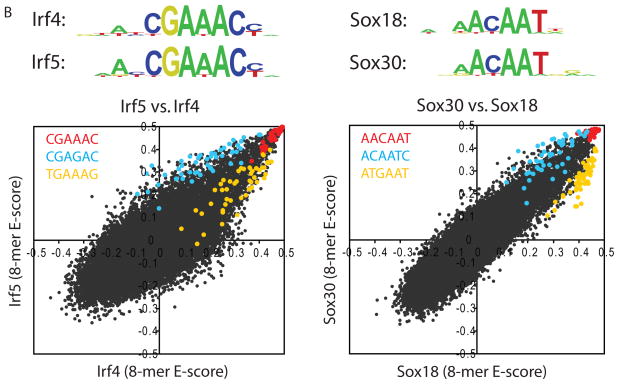
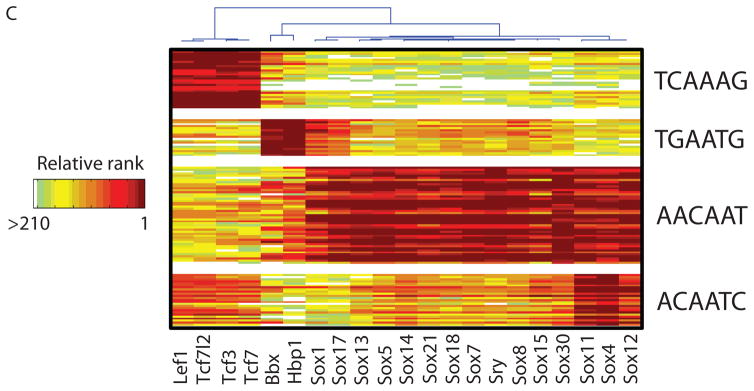
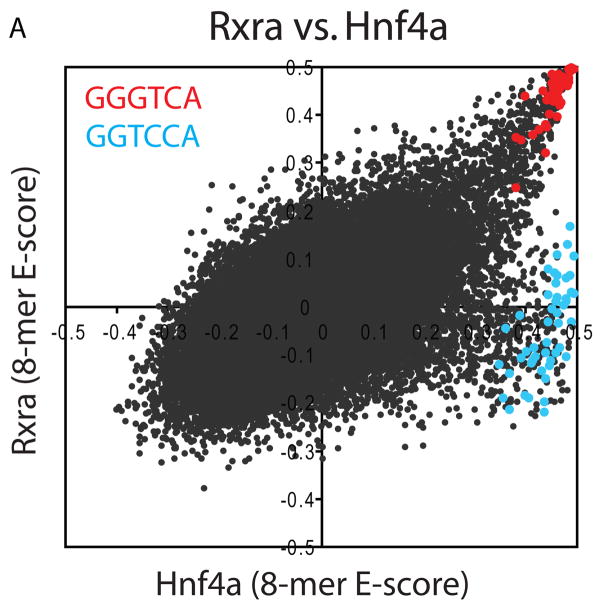
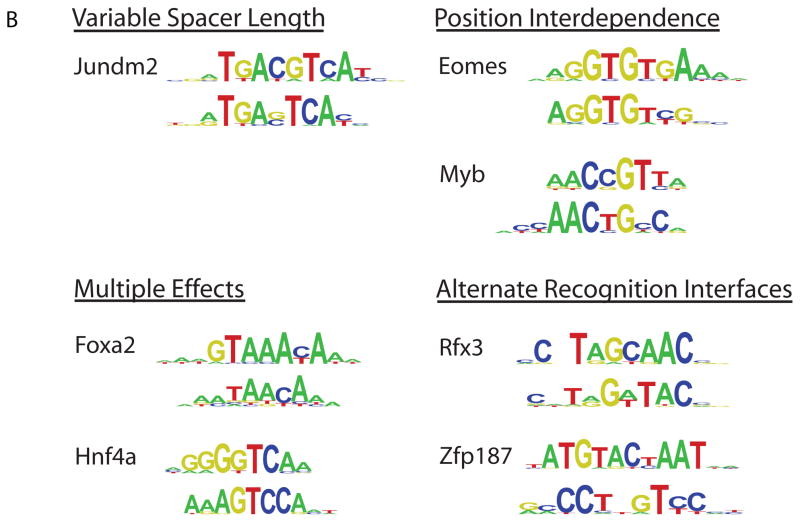
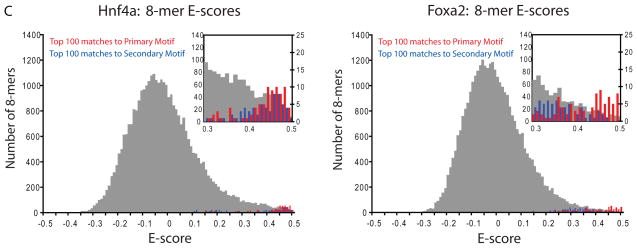
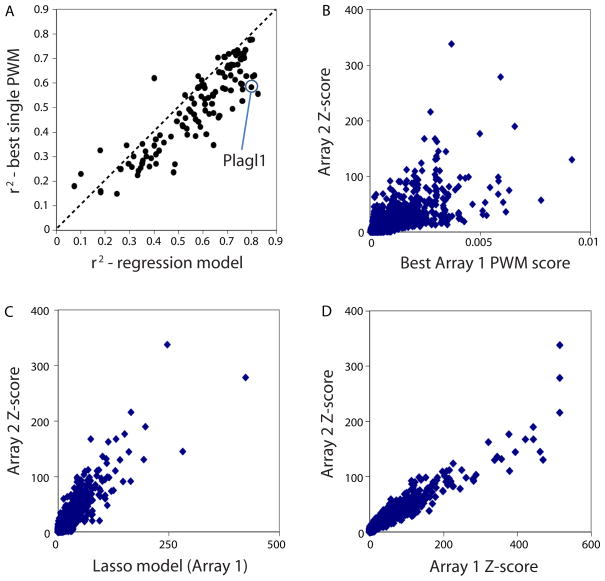
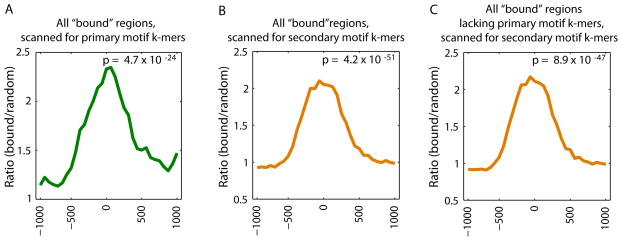
Sequence preferences of DNA binding proteins are a primary mechanism by which cells interpret the genome. Despite the central importance of these proteins in physiology, development, and evolution, comprehensive DNA binding specificities have been determined experimentally for only a few proteins. Here, we used microarrays containing all 10-base pair sequences to examine the binding specificities of 104 distinct mouse DNA binding proteins representing 22 structural classes. Our results reveal a complex landscape of binding, with virtually every protein analyzed possessing unique preferences. Roughly half of the proteins each recognized multiple distinctly different sequence motifs, challenging our molecular understanding of how proteins interact with their DNA binding sites. This complexity in DNA recognition may be important in gene regulation and in the evolution of transcriptional regulatory networks.


Figures

Figure 1
Figure 1
High-resolution PBM k-mer data. (A) Heatmap of 2-D hierarchical agglomerative clustering analysis of 4,740 ungapped 8-mers over 104 nonredundant TFs, with both 8-mers and proteins clustered using averaged E-score from the two different array designs. The 4,740 8-mers were selected because they have an E-score of 0.45 or greater for at least one of the proteins. A motif representative of the 8-mers contained in each of the indicated clusters is shown, derived from running the 8-mers on ClustalW (32) and entering groups of related aligned sequences into WebLogo (33). (B) Scatter plots comparing 8-mer scores for each pair of TFs, whose primary Seed-and-Wobble logos are shown above the plots. 8-mers containing each 6-mer sequence (inset) are highlighted, revealing consistent differences between sequence preferences among lower affinity 8-mers despite identical preferences for the same highest affinity 8-mers. (Left) Irf5 versus Irf4, (right) Sox30 versus Sox18. (C) Clustergram of k-mers for Sox family of TFs. 310 8-mers with E ≥ 0.45 for at least one of the 21 Sox and Sox-related TFs were hierarchically clustered according to their relative ranks for each TF, and then the rows, corresponding to k-mers, were rearranged to group together 8-mers with shared sequence patterns.
Figure 1
Figure 1
High-resolution PBM k-mer data. (A) Heatmap of 2-D hierarchical agglomerative clustering analysis of 4,740 ungapped 8-mers over 104 nonredundant TFs, with both 8-mers and proteins clustered using averaged E-score from the two different array designs. The 4,740 8-mers were selected because they have an E-score of 0.45 or greater for at least one of the proteins. A motif representative of the 8-mers contained in each of the indicated clusters is shown, derived from running the 8-mers on ClustalW (32) and entering groups of related aligned sequences into WebLogo (33). (B) Scatter plots comparing 8-mer scores for each pair of TFs, whose primary Seed-and-Wobble logos are shown above the plots. 8-mers containing each 6-mer sequence (inset) are highlighted, revealing consistent differences between sequence preferences among lower affinity 8-mers despite identical preferences for the same highest affinity 8-mers. (Left) Irf5 versus Irf4, (right) Sox30 versus Sox18. (C) Clustergram of k-mers for Sox family of TFs. 310 8-mers with E ≥ 0.45 for at least one of the 21 Sox and Sox-related TFs were hierarchically clustered according to their relative ranks for each TF, and then the rows, corresponding to k-mers, were rearranged to group together 8-mers with shared sequence patterns.
Figure 2
Figure 2
TF binding site secondary motifs. (A) Scatter plot comparing 8-mer E-scores for closely related TFs. Hnf4a and Rxra, two C4 zinc finger TFs, both exhibit strong binding to 8-mers containing GGGTCA (red), whereas Hnf4a shows specific binding to an additional set of 8-mers containing GGTCCA (blue). (B) Examples of motifs from different categories of secondary motifs. (C) Histograms of E-scores for all 8-mers (gray), the top 100 8-mer matches to the primary motif (red), and the top 100 8-mer matches to the secondary motif (blue). 8-mers were scored for matches to PWMs according to the GOMER (27) scoring framework. Insets provide a magnified display of the tails of the distributions; y-axis labels along the right of each inset refer to the red and blue bars. Based on the 8-mer scores, the primary and secondary Hnf4a motifs are essentially interchangeable (left), whereas Foxa2 shows a clear preference for 8-mers corresponding to its primary motif (right).
Figure 2
Figure 2
TF binding site secondary motifs. (A) Scatter plot comparing 8-mer E-scores for closely related TFs. Hnf4a and Rxra, two C4 zinc finger TFs, both exhibit strong binding to 8-mers containing GGGTCA (red), whereas Hnf4a shows specific binding to an additional set of 8-mers containing GGTCCA (blue). (B) Examples of motifs from different categories of secondary motifs. (C) Histograms of E-scores for all 8-mers (gray), the top 100 8-mer matches to the primary motif (red), and the top 100 8-mer matches to the secondary motif (blue). 8-mers were scored for matches to PWMs according to the GOMER (27) scoring framework. Insets provide a magnified display of the tails of the distributions; y-axis labels along the right of each inset refer to the red and blue bars. Based on the 8-mer scores, the primary and secondary Hnf4a motifs are essentially interchangeable (left), whereas Foxa2 shows a clear preference for 8-mers corresponding to its primary motif (right).
Figure 3
Figure 3
Multiple motif models typically better represent the binding profiles than do single motif models. (A) Considering all TFs in this study, in general multiple motif models are a better representation of the data than are single motif models. Variance in 8-mer median intensity (Z-score) on Array 2 explained by our PWM regression model (x-axis) compared to GOMER (27) scores for the single best PWM model obtained (best is defined as highest variance explained), over all 8-mers, with models derived from Array 1; the GOMER scoring framework calculates binding probabilities over the 8-mers according to PWMs (27). Each point represents one of the TFs analyzed. (B) The GOMER score for the best PWM derived from Array 1 is compared to the Z-scores from Array 2, for Plagl1 as a case example. Each point is a single 8-mer; all 32,896 8-mers are shown. (C) Same as (B), except the Array 1 regression model scores (which are a linear combination, built by using the least absolute shrinkage and selection operator (Lasso) algorithm (34), of GOMER scores from individual motifs) are compared to the Z-scores from Array 2. (D) 8-mer Z-scores for Plagl1 derived from Array 1 compared to the Z-scores from Array 2. Each point is a single 8-mer; all 32,896 8-mers are shown.
Figure 4
Figure 4
Enrichment of primary versus secondary motif sequences bound in vitro within genomic regions bound in vivo. Relative enrichment of k-mers corresponding to the primary versus secondary Seed-and-Wobble motifs within (A, B) all bound genomic regions in ChIP-chip data, or (C) those bound regions lacking primary motif k-mers, as compared to randomly selected sequences was calculated (5) for Hnf4a (GEO accession #GSE7745). ChIP-chip ‘bound’ peaks were identified according to the criteria of that study (28). A window size of 500 bp with a step size of 100 bp was used. The GOMER thresholds used are 2.958 × 10⁻⁷ and 8.419 × 10⁻⁷, corresponding to 9 primary and 20 secondary 8-mers scanned respectively for Hnf4a. P-values for enrichment of 8-mers within the bound genomic regions shown in each panel were calculated for the interval −250 to +250 by the Wilcoxon-Mann-Whitney rank sum test, comparing the number of occurrences per sequence in the bound set versus the background set.

References

    1. Tanay A. Genome Res. 2006 Jun 29; - PMC - PubMed
    1. Segal E, Raveh-Sadka T, Schroeder M, Unnerstall U, Gaul U. Nature. 2008 Jan 31;451:535. - PubMed
    1. Berger MF, et al. Nat Biotechnol. 2006 Nov;24:1429. - PMC - PubMed
    1. Li MZ, Elledge SJ. Nat Genet. 2005 Mar;37:311. - PubMed
    1. Materials and methods are available as supporting material on Science Online.

Publication types