Expression level and DNA methylation status of glutathione-S-transferase genes in normal murine prostate and TRAMP tumors
- PMID: 19444856
- PMCID: PMC2836025
- DOI: 10.1002/pros.20976
Expression level and DNA methylation status of glutathione-S-transferase genes in normal murine prostate and TRAMP tumors
Abstract
Background: Glutathione-S-transferase (Gst) genes are downregulated in human prostate cancer, and GSTP1 silencing is mediated by promoter DNA hypermethylation in this malignancy. We examined Gst gene expression and Gst promoter DNA methylation in normal murine prostates and Transgenic Adenocarcinoma of Mouse Prostate (TRAMP) tumors.
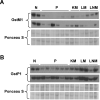
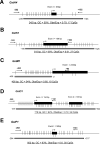
Methods: Primary and metastatic tumors were obtained from TRAMP mice, and normal prostates were obtained from strain-matched WT mice (n = 15/group). Quantitative real-time RT-PCR was used to measure GstA4, GstK1, GstM1, GstO1, and GstP1 mRNA expression, and Western blotting and immunohistochemical staining was used to measure GstM1 and GstP1 protein expression. MassARRAY Quantitative Methylation Analysis was used to measure DNA methylation of the 5' CpG islands of GstA4, GstK1, GstM1, GstO1, and GstP1. TRAMP-C2 cells were treated with the epigenetic remodeling drugs decitabine and trichostatin A (TSA) alone and in combination, and Gst gene expression was measured.
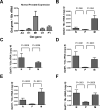
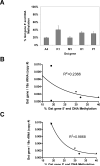
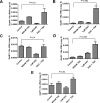
Results: Of the genes analyzed, GstM1 and GstP1 were expressed at highest levels in normal prostate. All five Gst genes showed greatly reduced expression in primary tumors compared to normal prostate, but not in tumor metastases. Gst promoter methylation was unchanged in TRAMP tumors compared to normal prostate. Combined decitabine + TSA treatment significantly enhanced the expression of 4/5 Gst genes in TRAMP-C2 cells.
Conclusions: Gst genes are extensively downregulated in primary but not metastatic TRAMP tumors. Promoter DNA hypermethylation does not appear to drive Gst gene repression in TRAMP primary tumors; however, pharmacological studies using TRAMP cells suggest the involvement of epigenetic mechanisms in Gst gene repression.
Figures


Similar articles
-
DNA hypermethylation regulates the expression of members of the Mu-class glutathione S-transferases and glutathione peroxidases in Barrett's adenocarcinoma.Gut. 2009 Jan;58(1):5-15. doi: 10.1136/gut.2007.146290. Epub 2008 Jul 29. Gut. 2009. PMID: 18664505 Free PMC article.
-
Cytosine methylation represses glutathione S-transferase P1 (GSTP1) gene expression in human prostate cancer cells.Cancer Res. 2001 Jun 15;61(12):4820-6. Cancer Res. 2001. PMID: 11406558
-
Reversal of GSTP1 CpG island hypermethylation and reactivation of pi-class glutathione S-transferase (GSTP1) expression in human prostate cancer cells by treatment with procainamide.Cancer Res. 2001 Dec 15;61(24):8611-6. Cancer Res. 2001. PMID: 11751372
-
Preneoplastic prostate lesions: an opportunity for prostate cancer prevention.Ann N Y Acad Sci. 2001 Dec;952:135-44. doi: 10.1111/j.1749-6632.2001.tb02734.x. Ann N Y Acad Sci. 2001. PMID: 11795433 Review.
-
Glutathione S-transferase pi (GSTP1) hypermethylation in prostate cancer: review 2007.Pathology. 2007 Jun;39(3):299-304. doi: 10.1080/00313020701329906. Pathology. 2007. PMID: 17558856 Review.
Cited by
-
Prognostic biomarker GSTK1 in head and neck squamous cell carcinoma and its correlation with immune infiltration and DNA methylation.Front Genet. 2023 Mar 3;14:1041042. doi: 10.3389/fgene.2023.1041042. eCollection 2023. Front Genet. 2023. PMID: 36936420 Free PMC article.
-
Epigenetic CpG Methylation of the Promoter and Reactivation of the Expression of GSTP1 by Astaxanthin in Human Prostate LNCaP Cells.AAPS J. 2017 Mar;19(2):421-430. doi: 10.1208/s12248-016-0016-x. Epub 2016 Dec 2. AAPS J. 2017. PMID: 27913949
-
Crossbred Sows Fed a Western Diet during Pre-Gestation, Gestation, Lactation, and Post-Lactation Periods Develop Signs of Lean Metabolic Syndrome That Are Partially Attenuated by Spirulina Supplementation.Nutrients. 2022 Aug 30;14(17):3574. doi: 10.3390/nu14173574. Nutrients. 2022. PMID: 36079836 Free PMC article.
-
Glutathione-s-transferase A 4 (GSTA4) suppresses tumor growth and metastasis of human hepatocellular carcinoma by targeting AKT pathway.Am J Transl Res. 2017 Feb 15;9(2):301-315. eCollection 2017. Am J Transl Res. 2017. PMID: 28337261 Free PMC article.
-
Epigenetic DNA methylation of antioxidative stress regulator NRF2 in human prostate cancer.Cancer Prev Res (Phila). 2014 Dec;7(12):1186-97. doi: 10.1158/1940-6207.CAPR-14-0127. Epub 2014 Sep 29. Cancer Prev Res (Phila). 2014. PMID: 25266896 Free PMC article.
References
-
- Hayes JD, Pulford DJ. The glutathione S-transferase supergene family: regulation of GST and the contribution of the isoenzymes to cancer chemoprotection and drug resistance. Crit Rev Biochem Mol Biol. 1995;30(6):445–600. - PubMed
-
- Rushmore TH, Pickett CB. Glutathione S-transferases, structure, regulation, and therapeutic implications. J Biol Chem. 1993;268(16):11475–11478. - PubMed
-
- Hayes JD, Flanagan JU, Jowsey IR. Glutathione transferases. Annu Rev Pharmacol Toxicol. 2005;45:51–88. - PubMed
-
- Bostwick DG, Burke HB, Djakiew D, Euling S, Ho SM, Landolph J, Morrison H, Sonawane B, Shifflett T, Waters DJ, Timms B. Human prostate cancer risk factors. Cancer. 2004;101(10 Suppl):2371–2490. - PubMed
Publication types
MeSH terms
Substances
Grants and funding
LinkOut - more resources
Full Text Sources
Medical
Molecular Biology Databases
Research Materials
Miscellaneous

