

Mapping the regional influence of genetics on brain structure variability--a tensor-based morphometry study
- PMID: 19446645
- PMCID: PMC2859973
- DOI: 10.1016/j.neuroimage.2009.05.022
Mapping the regional influence of genetics on brain structure variability--a tensor-based morphometry study
Abstract
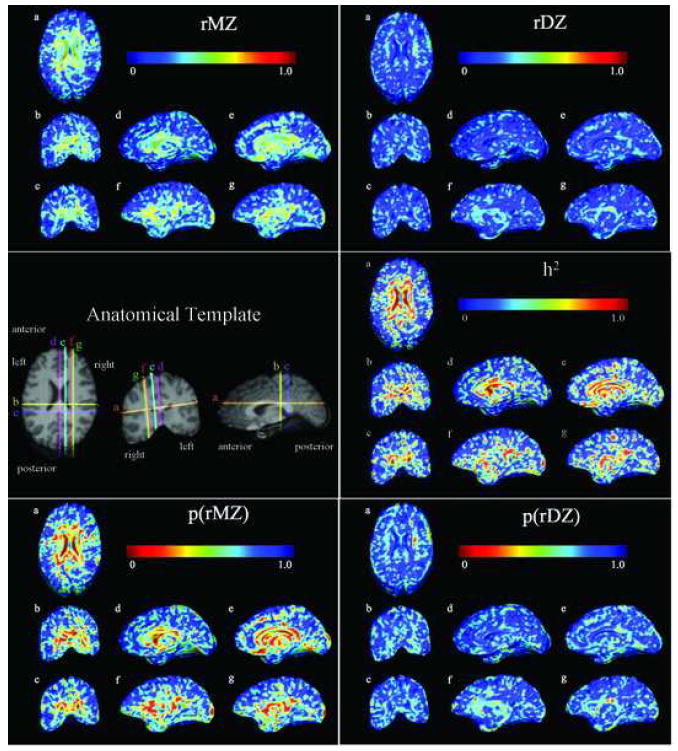
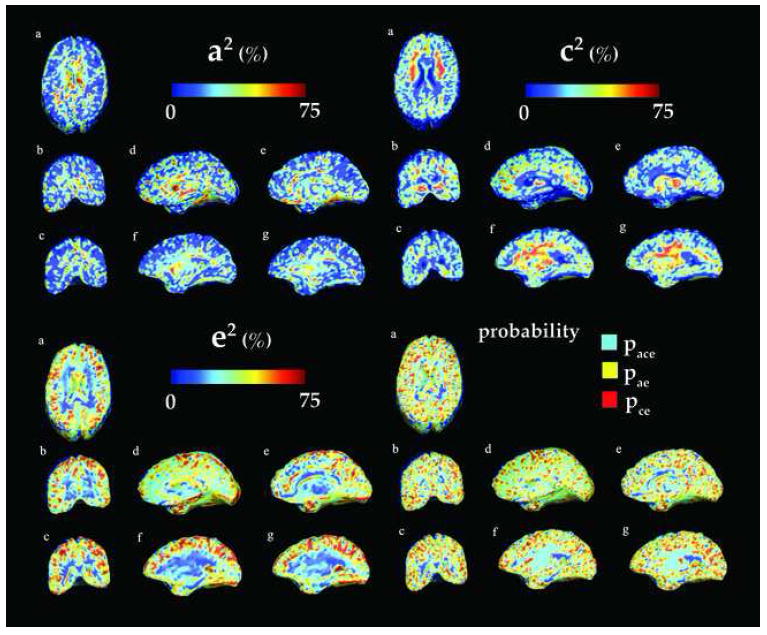
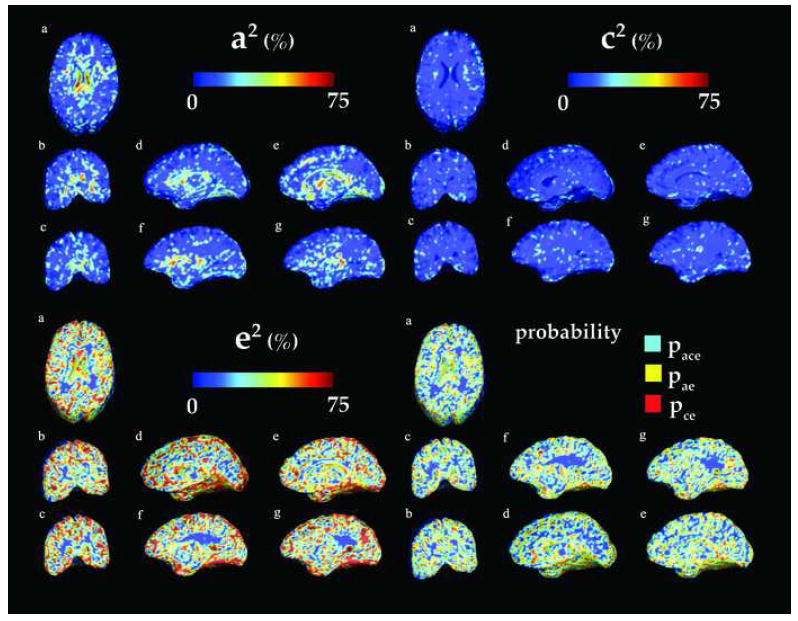
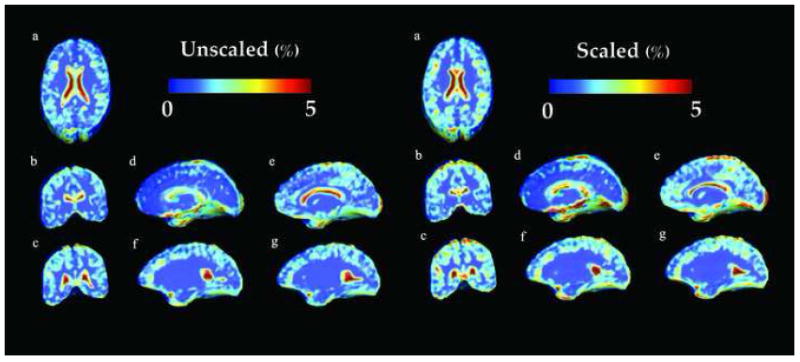
Genetic and environmental factors influence brain structure and function profoundly. The search for heritable anatomical features and their influencing genes would be accelerated with detailed 3D maps showing the degree to which brain morphometry is genetically determined. As part of an MRI study that will scan 1150 twins, we applied Tensor-Based Morphometry to compute morphometric differences in 23 pairs of identical twins and 23 pairs of same-sex fraternal twins (mean age: 23.8+/-1.8 SD years). All 92 twins' 3D brain MRI scans were nonlinearly registered to a common space using a Riemannian fluid-based warping approach to compute volumetric differences across subjects. A multi-template method was used to improve volume quantification. Vector fields driving each subject's anatomy onto the common template were analyzed to create maps of local volumetric excesses and deficits relative to the standard template. Using a new structural equation modeling method, we computed the voxelwise proportion of variance in volumes attributable to additive (A) or dominant (D) genetic factors versus shared environmental (C) or unique environmental factors (E). The method was also applied to various anatomical regions of interest (ROIs). As hypothesized, the overall volumes of the brain, basal ganglia, thalamus, and each lobe were under strong genetic control; local white matter volumes were mostly controlled by common environment. After adjusting for individual differences in overall brain scale, genetic influences were still relatively high in the corpus callosum and in early-maturing brain regions such as the occipital lobes, while environmental influences were greater in frontal brain regions that have a more protracted maturational time-course.
Figures
Similar articles
-
Mapping genetic influences on ventricular structure in twins.Neuroimage. 2009 Feb 15;44(4):1312-23. doi: 10.1016/j.neuroimage.2008.10.036. Epub 2008 Nov 7. Neuroimage. 2009. PMID: 19041405 Free PMC article.
-
Genetic influences on brain asymmetry: a DTI study of 374 twins and siblings.Neuroimage. 2010 Aug 15;52(2):455-69. doi: 10.1016/j.neuroimage.2010.04.236. Epub 2010 Apr 27. Neuroimage. 2010. PMID: 20430102 Free PMC article.
-
A tensor-based morphometry study of genetic influences on brain structure using a new fluid registration method.Med Image Comput Comput Assist Interv. 2008;11(Pt 2):914-21. doi: 10.1007/978-3-540-85990-1_110. Med Image Comput Comput Assist Interv. 2008. PMID: 18982692 Free PMC article.
-
Shared genetic influences on adolescent body mass index and brain structure: A voxel-based morphometry study in twins.Neuroimage. 2019 Oct 1;199:261-272. doi: 10.1016/j.neuroimage.2019.05.053. Epub 2019 Jun 1. Neuroimage. 2019. PMID: 31163268 Free PMC article.
-
Heritability of changes in brain volume over time in twin pairs discordant for schizophrenia.Arch Gen Psychiatry. 2008 Nov;65(11):1259-68. doi: 10.1001/archpsyc.65.11.1259. Arch Gen Psychiatry. 2008. PMID: 18981337
Cited by
-
Quantification of sulcal emergence timing and its variability in early fetal life: Hemispheric asymmetry and sex difference.Neuroimage. 2022 Nov;263:119629. doi: 10.1016/j.neuroimage.2022.119629. Epub 2022 Sep 14. Neuroimage. 2022. PMID: 36115591 Free PMC article.
-
Mapping longitudinal development of local cortical gyrification in infants from birth to 2 years of age.J Neurosci. 2014 Mar 19;34(12):4228-38. doi: 10.1523/JNEUROSCI.3976-13.2014. J Neurosci. 2014. PMID: 24647943 Free PMC article.
-
Genome-wide association analysis with gray matter volume as a quantitative phenotype in first-episode treatment-naïve patients with schizophrenia.PLoS One. 2013 Sep 24;8(9):e75083. doi: 10.1371/journal.pone.0075083. eCollection 2013. PLoS One. 2013. PMID: 24086445 Free PMC article.
-
Vision Transformer Autoencoders for Unsupervised Representation Learning: Capturing Local and Non-Local Features in Brain Imaging to Reveal Genetic Associations.medRxiv [Preprint]. 2025 Mar 25:2025.03.24.25324549. doi: 10.1101/2025.03.24.25324549. medRxiv. 2025. PMID: 40196251 Free PMC article. Preprint.
-
A novel classification framework for genome-wide association study of whole brain MRI images using deep learning.PLoS Comput Biol. 2024 Oct 15;20(10):e1012527. doi: 10.1371/journal.pcbi.1012527. eCollection 2024 Oct. PLoS Comput Biol. 2024. PMID: 39405331 Free PMC article.
References
-
- Arsigny V, Fillard P, Pennec X, Ayache N. Log-Euclidean metrics for fast and simple calculus on diffusion tensors. Mag Res Med. 2006;56(2):411–421. - PubMed
-
- Ashburner J, Friston KJ. Voxel-based Morphometry: the methods. NeuroImage. 2000;11(6):805–821. - PubMed
-
- Aubert-Broche B, Fonov V, Leppert I, Pike GB, Collins LD. Human Brain Myelination from birth to 4.5 years. International conference on Medical Image Computing and Computer Assisted Intervention (MICCAI); New-York, USA. September 7-9 (2008). - PubMed
-
- Baaré WF, Hulshoff Pol HE, Boomsma DI, Posthuma D, de Geus EJ, Schnack HG, van Haren NE, van Oel CJ, Kahn RS. Quantitative genetic modeling of variation in human brain morphology. Cereb Cortex. 2001;11(9):816–824. - PubMed
-
- Bartley AJ, Jones DW, Weinberger DR. Genetic variability of human brain size and cortical gyral patterns. Brain. 1997;120(2):257–269. - PubMed
Publication types
MeSH terms
Grants and funding
LinkOut - more resources
Full Text Sources
Medical
Research Materials
