. 2009 Jul;51(1):77-92.
doi: 10.1016/j.jhep.2009.02.022. Epub 2009 Apr 5.

Establishment of cancer cell lines from rat hepatocholangiocarcinoma and assessment of the role of granulocyte-colony stimulating factor and hepatocyte growth factor in their growth, motility and survival

Affiliations

Establishment of cancer cell lines from rat hepatocholangiocarcinoma and assessment of the role of granulocyte-colony stimulating factor and hepatocyte growth factor in their growth, motility and survival

Anna C Piscaglia et al. J Hepatol. 2009 Jul.

Abstract

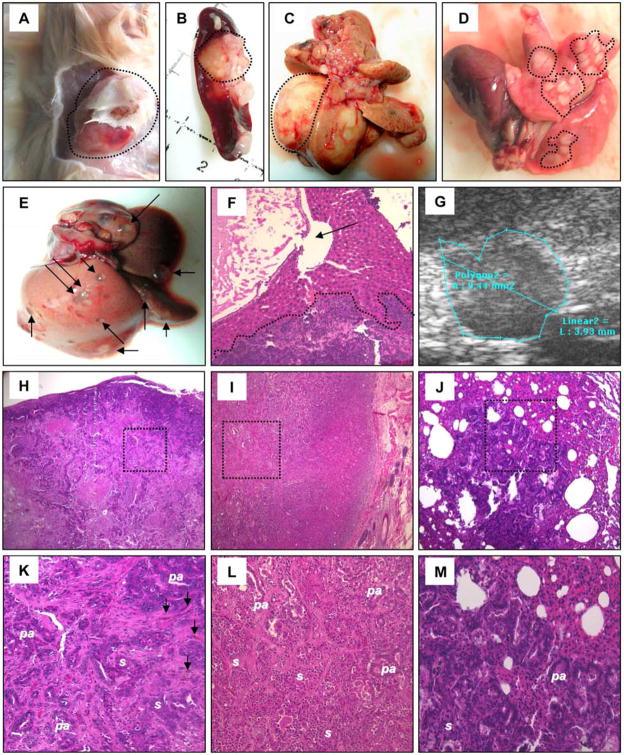
Background/aims: Oval cells (OCs), putative hepatic stem cells, may give rise to liver cancers. We developed a carcinogenesis regimen, based upon induction of OC proliferation prior to carcinogen exposure. In our model, rats subjected to 2-acetylaminofluorene/ partial-hepatectomy followed by aflatoxin injection (APA regimen) developed well-differentiated hepatocholangiocarcinomas. The aim of this study was to establish and characterize cancer cell lines from this animal model.

Methods: Cancer cells were cultured from animals sacrificed eight months after treatment, and single clones were selected. The established cell lines, named LCSCs, were characterized, and their tumorigenicity was assessed in vivo. The roles of granulocyte-colony stimulating factor (G-CSF) and hepatocyte growth factor (HGF) in LCSC growth, survival and motility were also investigated.

Results: From primary tumors, six cell lines were developed. LCSCs shared with the primary tumors the expression of various OC-associated markers, including cMet and G-CSF receptor. In vitro, HGF conferred protection from death by serum withdrawal. Stimulation with G-CSF increased LCSC growth and motility, while the blockage of its receptor inhibited LCSC proliferation and migration.

Conclusions: Six cancer cell lines were established from our model of hepatocholangiocarcinoma. HGF modulated LCSC resistance to apoptosis, while G-CSF acted on LCSCs as a proliferative and chemotactic agent.


Figures

Figure 1
Figure 1. Study design
(A) Schematic representation of the experimental procedures administered to rats treated with the APA regimen and to control rats (2AAF/PH, 2AAF alone, 2AAF/AFB1). The timing is indicated by considering “day 0” as the day of AFB1 injection (d = day, m = months). (B) APA regimen and establishment of liver cancer cell lines. Fragments of liver cancers, obtained from rats subjected to the APA regimen and sacrificed 8 months after AFB1 injection, were disassociated and the cell suspension was seeded in culture. The established cell lines, named LCSCs, were characterized. Tumorigenicity assays were performed on rats pre-treated with MCT/PH. Cancer cell lines were established from transplanted tumors and named LCSC-Tx.
Figure 2
Figure 2. The APA regimen induced well-differentiated hepatocholangiocarcinomas
The liver remnant presented a cirrhotic degeneration, with grossly apparent nodules, the borders of which were defined by fibrotic cords (A, arrows), mainly comprised by OV6 + cells (B; the insert depicts an OV6+ cord at higher magnification). There was evidence of both hepatocellular and cholangiolar differentiation within these cords (C, arrows and arrow-head, respectively). Nodules of well-differentiated HCC displayed a frequent pseudoglandular pattern (D) and were populated by dysplastic Ki67+ (E) and GSTp+ (F) cells. The CCC areas (G) were formed by large foci of dysplastic Ki67+ (H), OV6+ (I), CK19+ (J) cells. Mucin accumulation within the aberrant ducts, indicating intestinal metaplasia (K), and a moderate degree of cholangiofibrosis (L) were also noted. Panels A, B, G, H, I, J, K, and L depict liver sections obtained from rats sacrificed 8 months after AFB1 injection; the remaining panels (C–F) represent sections from rats sacrificed 4 months after AFB1 injection.
Figure 3
Figure 3. hepatocholangiocarcinomas expressed G-CSF, G-CSFR, OV6, cMet and OCT3/4
G-CSF and its receptor were co-expressed in HCC and CCC areas. Panels (A–C) illustrate G-CSFR (green, A)/G-CSF (red, B) double-positive cancer cells (yellow, C) within an area of HCC. Panels (D–F) show a CCC area where many OV6+ cancer cells (red, E) co-expressed G-CSFR (green, D); panel F depicts the merging panel (yellow). Representative double-positive cells and clusters are indicated by arrows and arrow-heads, respectively. Nuclei were stained with DAPI (blue). A large proportion of cancer cells were cMet+ (G, H - the latter depicts cMet+ cells at higher magnification). Conversely, very few cancer cells, small in size, expressed OCT3/4 (panel I shows OCT3/4+ cells within an HCC area). Panels (J–L) indicate one OCT3/4+ cancer cell (green, J) co-expressing OV6 (red, K) in a CCC focus. Merging panel is depicted in L (yellow). Nuclei were stained with DAPI (blue). OCT3/4+ cells in panels (I–L) are indicated by arrows.
Figure 4
Figure 4. LCSC morphology and expression pattern for AFP, OV6, G-CSF, and its receptor (A–C)
All LCSC lines consisted of a main fraction of relatively small cells, which displayed an epithelioid, polygonal-shaped morphology, clear cytoplasm, and large, round or oval nuclei, containing several prominent nucleoli (A,C). A second small fraction, within LCSCs, represented cells of very minute size and scant cytoplasm, named Sm-LCSCs, which were usually observed as isolated cells/small clusters (A-C, arrows) and also spheroid aggregates (B, area). Many Ep-LCSCs and Sm-LCSCs stained positive for AFP, as showed in panels D–F (single immunofluorescence; arrows point at single Sm-cells). G-CSFR was expressed by a large percentage of LCSCs (G,J, green), co-localizing with G-CSF (H, red), and OV6 (K, red). Merging panels are depicted respectively in I and L, respectively (in JL, double positive cells are indicated by arrows).
Figure 5
Figure 5. LCSC expression pattern for cMet, OV6, and OCT3/4
Many cells within all lines also expressed cMet (A). Panels B and C depict clusters of OCT3/4+ Sm-LCSC cells (areas). OCT3/4 (D,G, green) was found in co-expression with OV6 (E,H, red), by very rare, small cells corresponding to Sm-LCSCs. Merging panels are depicted in F and I, respectively (double positive cells are indicated by arrows). Cell nuclei were stained with DAPI (blue).
Figure 6
Figure 6. LCSC gene expression profile, growth kinetics and karyotype
Panel A depicts LCSC-2 and LCSC-4 gene expression for alphafetoprotein (AFP), albumin (Alb), G-CSFR, CK19 and OCT3/4. LCSCs expressed the above mentioned genes at early passages and retained this phenotype at late passages: panel B depicts a representative RT-PCR (from LCSC-2) for Alb and AFP at passage 4 (P4) and 30 (P30), versus negative and positive controls (ctrl- and ctrl+, respectively). A representative growth kinetics (from LCSC-2) is shown in panel C. The diagram in panel D shows the ploidy analysis of LCSCs, in terms of distribution of chromosome numbers per cell; representative images of karyotypes from normal rat cells and cancer cells are also displayed.
Figure 7
Figure 7. Tumorigenicity assays
Representative pictures of transplanted tumors (at about 4 months following LCSC-2 transplantation), within skin (A), spleen (B) and liver (C), are shown (areas). Panels (D–F) illustrate the aspect of multiple pulmonary metastases (D, areas) and cystic dilations of the biliary tree (E,F; arrows) associated with hepatic metastases (F, area), at about 4 months following LCSC-2 transplantation. Panel G depicts an intra-hepatic small nodule detected by ultrasonography in an asymptomatic animal after about 1 month following injection of LCSC-4. (H–M) Histologically, the tumors were mixed CCC/HCC, consisting of epithelioid LCSC-like cells, with solid (s) or pseudo-acinar (pa) organization. The following representative images of cancer nodules are depicted (at low and high magnification, respectively): intra-splenic tumor (H, K), sub-cutaneous tumor (I, L), and lung metastasis (J, M). Bile accumulations are pointed out by arrows in panel K.
Figure 8
Figure 8. LCSC-Tx characterization
(A–C)Section of an intra-splenic tumor (obtained following LCSC-2 injection) showing G-CSFR expression (A, green) in co-localization with OV6 (B, red) in cancer cells. Panel C results from the merging of A and B. Representative double-positive cells and clusters are indicated by arrows and arrow-heads, respectively. Cell nuclei were stained with DAPI (blue). (D) Representative image of LCSC-Tx morphology, showing a cluster of Sm-cells (area) surrounded by Ep-cells (from LCSC-Tx-spleen). (E) RT-PCR for G-CSFR gene expression in LCSC-Tx-spleen, -lung, and –skin (= S.C.): all cell lines expressed G-CSFR mRNA. (F–L) LCSC-Tx-spleen expressed OV6 (F, K,L) and co-expressed G-CSFR/G-CSF (G-I), and G-CSFR/OV6 (J–L). Representative double-positive cells are indicated by arrows. Cell nuclei were stained with DAPI (blue).
Figure 9
Figure 9. Role of HGF/cMet on LCSC survival
Panel A depicts the response of LCSC-5 to HGF stimulation (western blot): LCSCs were able to respond to HGF (50 or 100 ng/ml), by increasing the phosphorylation of cMet (p-Met) and of its downstream transducer ERK1/2 kinase (p-ERK). SHP-2 served as loading control. Panel B shows the response of LCSC-2 and of LCSC-Tx-skin to HGF stimulation (100 ng/ml): both lines responded to HGF by increasing the phosphorylation of Met and of its downstream effectors (ERK, AKT). Panels C–F: LCSC-2 incubated in starvation conditions (at day 5) with or without HGF: DMEM, 4.5 g/L Glucose, no FBS (C), DMEM, no Glucose, 5% FBS (D), DMEM, no Glucose, no FBS (E), DMEM, 4.5g/L Glucose, no FBS, 10ng/ml HGF (F). Arrows indicates Sm-LCSC cords; the letter “a” marks zones of Ep-LCSCs loss; areas in panel F include surviving Ep-LCSCs.
Figure 10
Figure 10. Role of G-CSF on LCSC Proliferation and migration
Diagrams depicting the effects of both G-CSF and anti-G-CSFR on cultured liver oval cells (HOC) and on LCSCs (line 2). The exact p values are reported. Panel A: G-CSF, at the dose of 100 ng/ml, was able to increase HOC proliferation when compared to the controls. Conversely, incubation with anti-G-CSFR resulted in an almost complete inhibition of the HOC proliferative potential (upper diagram). Similarly, LCSC proliferation was stimulated by G-CSF, while incubation with anti-G-CSFR significantly reduced the capacity of LCSC to proliferate (lower diagram). Abbreviations: negative control (ctrl-), positive control (ctrl+), experimental group treated with G-CSF (G-CSF), experimental group treated with anti-G-CSFR antibody (anti-G-CSFR). Panel B: G-CSF, at the dose of 100 ng/ml, was able to exert a significant chemotactic effect, contributing to HOC migration. Conversely, incubation with anti-G-CSFR prevented HOC from migrating in response to a G-CSF gradient (white bars). Similarly, LCSC were able to migrate following a G-CSF gradient, whereas pre-treatment with anti-G-CSFR prevented cell migration (black bars). Abbreviations: migration control (N/N), chemokinetic control (G-CSF added to both chambers, GF/GF), experimental group (G-CSF added to the lower chamber, N/GF), experimental group of cells pre-treated with anti-G-CSF antibody and then G-CSF added to the lower chamber (PRE-N/GF), migration control for pre-treated cells (PRE-N/N).

Similar articles

Cited by

References

    1. Piscaglia AC, Shupe DT, Petersen BE, Gasbarrini A. Stem Cells, Cancer, Liver, and Liver Cancer Stem Cells: Finding a Way out of the Labyrinth…. Curr Cancer Drug Targets. 2007;7:582–590. - PubMed
    1. Li L, Neaves WB. Normal stem cells and cancer stem cells: the niche matters. Cancer Res. 2006;66:4553–4557. - PubMed
    1. Ma S, Chan KW, Hu L, Lee TK, Wo JY, Ng IO, et al. Identification and characterization of tumorigenic liver cancer stem/progenitor cells. Gastroenterology. 2007;132:2542–2556. - PubMed
    1. Piscaglia AC. Stem cells, a two-edged sword: Risks and potentials of regenerative medicine. World J Gastroenterol. 2008;14:4273–4279. - PMC - PubMed
    1. Jordan CT, Guzman ML, Noble M. Cancer stem cells. N Engl J Med. 2006;355:1253–1261. - PubMed

Publication types

MeSH terms

Substances