. 2009 May 14;62(3):327-34.
doi: 10.1016/j.neuron.2009.04.014.

Genetic identification of an On-Off direction-selective retinal ganglion cell subtype reveals a layer-specific subcortical map of posterior motion

Affiliations

Genetic identification of an On-Off direction-selective retinal ganglion cell subtype reveals a layer-specific subcortical map of posterior motion

Andrew D Huberman et al. Neuron. .

Abstract

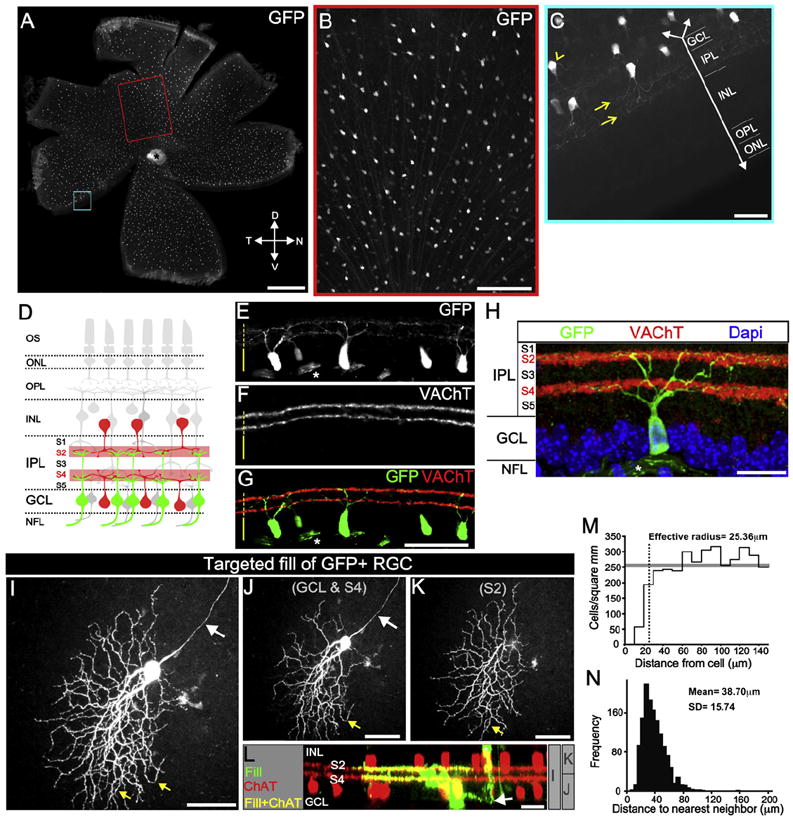
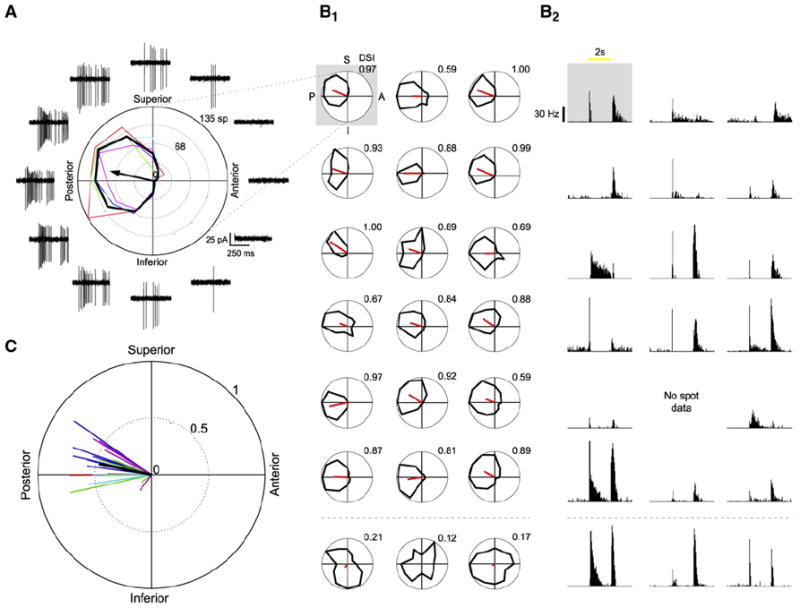
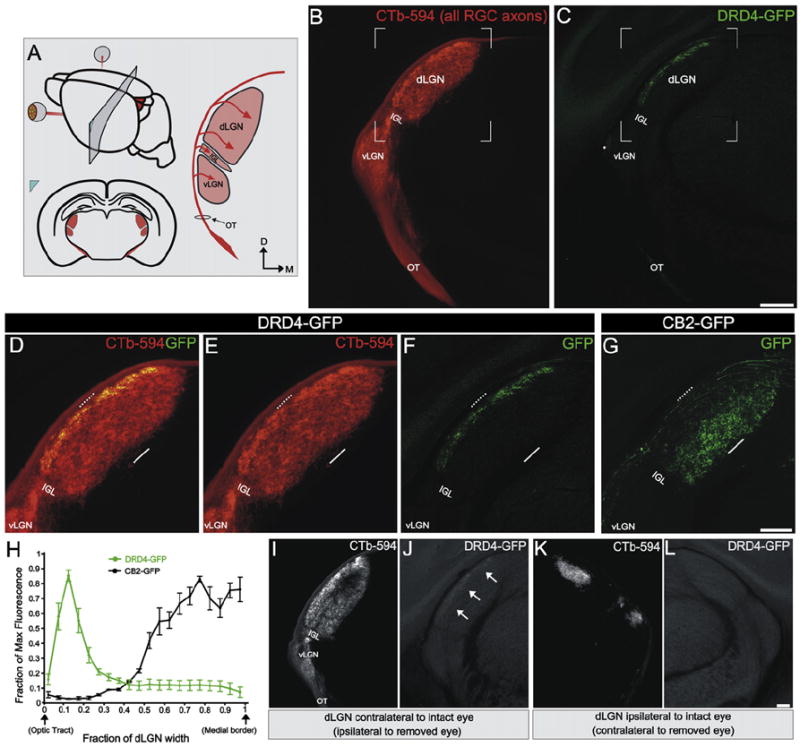
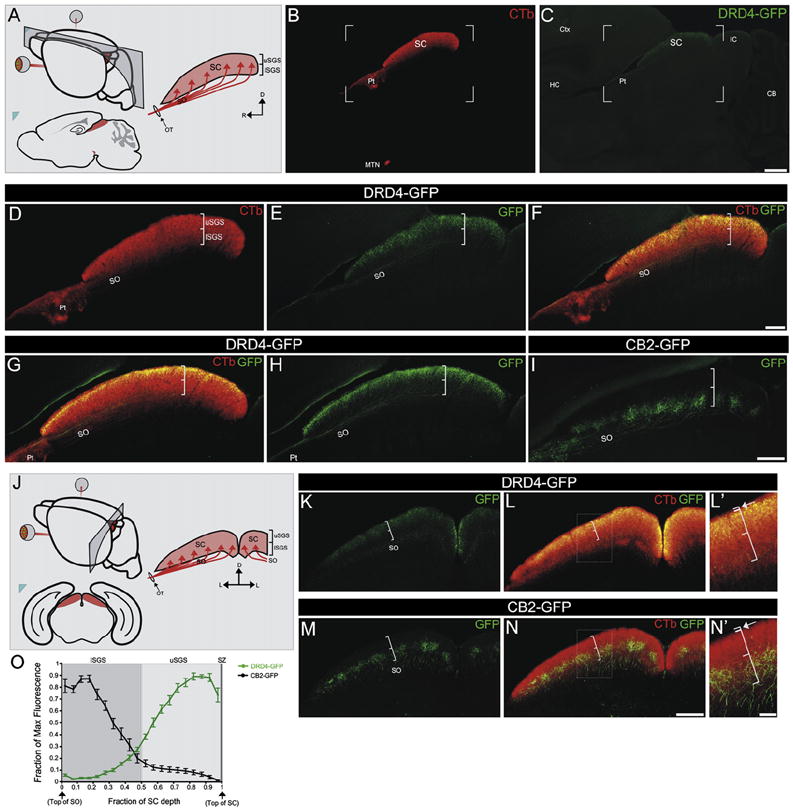
Motion detection is an essential component of visual processing. On-Off direction-selective retinal ganglion cells (On-Off DSGCs) detect objects moving along specific axes of the visual field due to their precise retinal circuitry. The brain circuitry of On-Off DSGCs, however, is largely unknown. We report a mouse with GFP expressed selectively by the On-Off DSGCs that detect posterior motion (On-Off pDSGCs), allowing two-photon targeted recordings of their light responses and delineation of their complete map of central connections. On-Off pDSGCs project exclusively to the dorsal lateral geniculate nucleus and superior colliculus and in both targets form synaptic lamina that are separate from a lamina corresponding to non-DSGCs. Thus, individual On-Off DSGC subtypes are molecularly distinct and establish circuits that map specific qualities of directional motion to dedicated subcortical areas. This suggests that each RGC subtype represents a unique parallel pathway whose synaptic specificity in the retina is recapitulated in central targets.


Figures

Figure 1
Figure 1. A Mosaic of GFP+ On-Off RGCs in DRD4-GFP Mice
(A) Fluorescence image of whole-mount DRD4-GFP retina. T, temporal; N, nasal; D, dorsal; V, ventral. Scale bar, 500 μm. (B) Red-framed region in (A). Scale bar, 200 μm. (C) Blue-framed region in (A). Downward arrow, axis perpendicular to retinal layers. GFP+ dendrites (yellow arrows) in the inner plexiform layer (IPL). INL, inner nuclear layer; OPL, outer plexiform layer; ONL, outer nuclear layer. Arrowhead, GFP+ axon. Scale bar, 50 μm. (D) Starburst amacrine cell (SBAC) somas (red) and dendrites (pale red) in IPL sublamina 2 (S2) and S4. On-Off DGSCs (green) project dendrites to S2 and S4. Labels as in (C), plus NFL, nerve fiber layer; and OS, outer segments. (E–H) DRD4-GFP retinas stained for GFP (E), VAChT (F), and merged (G and H). Asterisks, GFP+ axons. Dashed line, IPL. Solid line, GCL. (E–G) Scale bar, 100 μm. (H) Scale bar, 50 μm. (I–L). Biocytin-filled GFP+ RGC and ChAT+ SBACs. (I) Complete view of filled RGC. White arrow, axon. Yellow arrows, “looping” arborizations. (J) The portion of the RGC in GCL-S4 and, (K) in S2. (L) Side view of the filled RGC (green) and ChAT+ SBACs (red) and their overlap (yellow). Arrow, axon. Asterisk, amacrine cell. Gray bars, depths of view for (I)–(K). Scale bar, 50 μm (I–K) and 25 μm (L). (M) Density recovery profile (Rodieck, 1991). Gray bar, average cell density. Dashed line, effective radius, within which it was rare to observe another GFP+ soma. (N) Distribution of the distances between nearest-neighbor GFP+ RGCs.
Figure 2
Figure 2. Two-Photon Targeted Recordings of GFP+ Cells Reveal a Preference for Posterior Motion
(A) A GFP+ RGC’s responses to drifting gratings. Black tuning curve shows the mean response (spike count during 3 s of gratings); colored curves show the responses for each repetition (red, green, blue, cyan, magenta). Black arrow indicates the vector sum of responses. Traces show the data for the first 500 ms of gratings stimuli (two periods). Frequent presentation of edges in the gratings stimulus makes resolving the on and off responses difficult. (B) Light responses for all recorded cells. (B1) Responses to drifting gratings. Black curve shows the mean response for each cell. Red line shows the vector sum of the responses (see Supplemental Experimental Procedures). Gray box indicates the cell shown in (A). Cells with DSI lower than 0.5 are shown in the last row. (B2) Spike-density histograms of corresponding On and Off spike responses to a 100 μm spot shown centered on the soma (ten repetitions, 50 ms bins). Yellow bar represents the time of the spot stimuli. (C) Vector sums of all recorded cells (n = 21 cells from 5 retinas, 5 mice). Each color indicates a different retinal preparation. The black line shows the mean vector sum of all the cells.
Figure 3
Figure 3. On-Off pDSGCs Form Laminar-Specific Connections in the dLGN
(A) Schematic of region shown in (B)–(L) and RGC axons entering the dLGN (arrows). Red, RGC axons from both eyes labeled with CTb-594; OT, optic tract; vLGN, ventral lateral geniculate nucleus; IGL, intergeniculate leaflet; dLGN, dorsal lateral geniculate nucleus. D, dorsal; M, medial. (B) CTb+ RGC axons at the level depicted in (A). (C) GFP+ On-Off pDSGC axons at the level depicted in (A). (B and C) Scale bar, 400 μm. (D–F) Area framed in (B) and (C). Dashed line, lateral dLGN; solid line, medial dLGN. (D) Merge of CTb+ and GFP+ RGC axons. (E) CTb+ RGC axons. (F) GFP+ On-Off pDSGC axons. (G) GFP+ tOff-αRGCs axons (Huberman et al., 2008). (D–G) Scale bar, 200 μm. (H) Fluorescence intensity across the dLGN width in DRD4-GFP and CB2-GFP mice. (n = 2 CB2 mice and n = 3 DRD4 mice; ±SEMs). (I–L) CTb+ (I and K) and GFP+ (J and L) axons in the in dLGN contralateral (I and J) and ipsilateral (K and L) to the intact eye of a DRD-GFP mouse with one eye removed. (J) arrows, GFP+ On-Off DSGC lamina. (L) No GFP+ axons are present. Scale bar, 100 μm.
Figure 4
Figure 4. On-Off pDSGCs Form Laminar-Specific Connections in the SC
(A) Schematic of regions shown in (B)–(I) and sagittal view of RGC axons entering the SC (red arrows). SC, superior colliculus; SO, stratum opticum; brackets denote the uSGS (upper stratum griseum superficialis) and lSGS (lower stratum griseum superficialis). R, rostral; C, caudal; D, dorsal. (B) CTb+ axons in the SC. Pt, pretectum; MTN, medial terminal nucleus. (C) GFP+ On-Off pDSGC axons in the SC. (B and C) Scale bar, 500 μm. (D–F) Framed area in (B) and (C). (D) CTb+ axons in the SO and SGS. Brackets denote uSGS and lSGS as in (A). (E) GFP+ On-Off pDSGC axons in the SO and uSGS. (F) Merge of (D) and (E). Scale bar, 200 μm. (G) Merged view of CTb+ and GFP+ On-Off pDSGC axons in the SC and (H) GFP+ axons viewed alone. (I) GFP+ tOff-αRGC axons targeting the lSGS, wherein they form columns (Huberman et al., 2008). (G–I) Scale bar, 200 μm. (J) Schematic of the region in (K)–(N) and coronal view of RGC axons entering the SC. L, lateral. (K–L′) GFP+ On-Off pDSGC axons (K) and merged with CTb+ axons (L) in the SC. (L′) Boxed region in (L). Brackets denote lSGS and uSGS. The thinner bracket (arrow) straddles the stratum zonale (SZ), a thin retinorecipient lamina above the uSGS. (M–N′) GFP+ tOff-αRGC axons (M) and merged with CTb+ axons (N) in the SC. (N′) Boxed region in (N). Conventions as in (L′). (K–N) Scale bar, 200 μm. (L′ and N′) Scale bar, 50 μm. (O) Fluorescence intensity along the SC depth in DRD4-GFP and CB2-GFP mice (n = 5 CB2 mice and n = 5 DRD4 mice; ±SEMs).

References

    1. Barlow HB, Hill RM. Selective sensitivity to direction of movement in ganglion cells of the rabbit retina. Science. 1963;139:412–414. - PubMed
    1. Berson DM. Retinal ganglion cell types and their central projections. In: Albright TD, Masland R, editors. The Senses: A Comprehensive Reference. Vol. 1. San Diego: Academic Press; 2008. pp. 491–520. Vision 1.
    1. Brainard DH. The psychophysics toolbox. Spat Vis. 1997;10:433–436. - PubMed
    1. Chan YC, Chiao CC. Effect of visual experience on the maturation of ON–OFF direction selective ganglion cells in the rabbit retina. Vision Res. 2008;48:2466–2475. - PubMed
    1. Chen M, Weng S, Deng Q, Xu Z, He S. Physiological properties of direction-selective ganglion cells in early postnatal and adult mouse retina. J Physiol. 2008;587:819–828. - PMC - PubMed

Publication types

MeSH terms

Substances

LinkOut - more resources