. 2009 Jul 1;78(1):70-7.
doi: 10.1016/j.bcp.2009.03.022. Epub 2009 Mar 31.

HIV protease inhibitor lopinavir-induced TNF-alpha and IL-6 expression is coupled to the unfolded protein response and ERK signaling pathways in macrophages

Affiliations

HIV protease inhibitor lopinavir-induced TNF-alpha and IL-6 expression is coupled to the unfolded protein response and ERK signaling pathways in macrophages

Li Chen et al. Biochem Pharmacol. .

Abstract

HIV protease inhibitor (PI)-associated cardiovascular risk, especially atherosclerosis, has become a major concern in the clinic. Macrophages are key players in the inflammatory response and atherosclerosis formation. We have previously shown that HIV PIs induce endoplasmic reticulum (ER) stress, activate the unfolded protein response (UPR), and increase the synthesis of the inflammatory cytokines, TNF-alpha and IL-6, by regulating the intracellular translocation of RNA binding protein HuR in macrophages. However, the underlying signaling mechanisms remain unclear. We show here that the HIV PI lopinavir significantly activated the extracellular-signal regulated protein kinase (ERK), but not c-Jun N-terminal kinase (JNK) and p38 MAPK. Lopinavir-induced cytosolic translocation of HuR and TNF-alpha and IL-6 synthesis was attenuated by specific chemical inhibitor of MEK (PD98058) or over-expression of dominant negative mutant of MEK1. In addition, we demonstrated that lopinavir-induced ERK activation and TNF-alpha and IL-6 expression were completely inhibited in macrophages from CHOP null mice. Taken together, these results indicate activation of the UPR plays an essential role in HIV PI-induced inflammatory cytokine synthesis and release by activating ERK, which increases the cytosolic translocation of HuR and subsequent binding to the 3'UTR of TNF-alpha and IL-6 mRNAs in macrophages.


Figures

Figure 1
Figure 1. Time course of HIV PI-induced TNF-α and IL-6 expression and ERK activation in macrophages
A. Time course of HIV PI-induced TNF-α and IL-6 expression in mouse J774A.1 cells. Cells were treated with 15 μM of amprenavir (a) or lopinavir (b) for 0, 0.5, 1, 2, 4, 6, 12, 18 or 24 h. At the end of treatment, the culture media and cells were collected separately. The amounts of TNF-α and IL-6 released to the media were analyzed by ELISA and normalized to the total protein amounts of the viable cell pellets as described in “Methods”, and expressed as a percent of the 0 time point control. Values are mean ± SE of 3 independent experiments. B. Time-course of HIV PI-induced ERK activation in mouse J774A.1 cells. Representative immunoblots from three independent experiments for phosphor (p)-ERK and total (T)-ERK from the total cell lysates of mouse J774A.1 macrophages treated with individual HIV PIs (15 μM) for 0, 0.5, 1, 2, 4, 8, 12, 18, and 24 h. (a) amprenavir; (b) lopinavir. The density of the immunoreactive bands was analyzed using Image J software. Relative density was shown.
Figure 2
Figure 2. Effect of over-expression of dominant negative mutants of MEK1 on HIV PI-induced TNF-α and IL-6 protein expression in macrophages
Mouse J774A.1 cells were infected with a recombinant adenovirus expressing a dominant-negative mutant MEK1 or CMV control virus (MOI=50). After 24 h, cells were treated with individual HIV PIs (15 μM), amprenavir (AMPV), lopinavir (LOPV) or vehicle control (DMSO) for 24 h. At the end of treatment, the culture media and cells were collected separately. The amounts of TNF-α and IL-6 released to the media were analyzed by ELISA and normalized to the total protein amounts of the viable cell pellets as described in “Methods”, and expressed as a percent of the vehicle control of control virus group. Values are mean ± SE of 3 independent experiments. Statistical significance relative to DMSO control within each treatment group, * p< 0.05. Statistical significance relative to control group, #p<0.05.
Figure 3
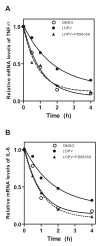
Figure 3. Effect of ERK inhibitor on HIV PI-induced TNF-α and IL-6 mRNA stability in macrophages
Mouse J774A.1 cells were pretreated with individual PD98059 (30 μM) for 30 min, and then treated with lopinavir (LOPV, 15 μM) or vehicle control (DMSO) for 16 h before addition of actinomycin D (5.0 μg/ml) (time 0). Total cellular RNA was extracted at 0, 0.5, 1, 2, and 4 h after actinomycin D addition. TNF-α (A) and IL-6 (B) mRNA levels were determined by real-time RT-PCR as described in “Methods”. Values are mean ± SE of 3 independent experiments.
Figure 4
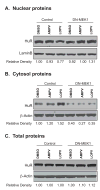
Figure 4. Effect of overexpression of DN-MEK1 on HIV PI-induced cytoplasmic translocation of RNA binding protein HuR in mouse macrophages
Mouse J774A.1 cells were infected with CMV control adenovirus or a recombinant DN-MEK1 adenovirus for 24 h and then treated with DMSO, amprenavir (AMPV, 15 μM), or lopinavir (LOPV, 15 μM) for 24 h. The nuclear proteins and cytoplasmic proteins were isolated as described in “Methods”. Three independent experiments were performed. (A) Representative immunoblot images against HuR and lamin B for nuclear proteins. (B) Representative immunoblot images against HuR and β-actin for cytoplasmic proteins. (C) Representative immunoblot images against HuR and β-actin for total proteins. The density of the immunoreactive bands was analyzed using Image J software and normalized to lamin B or β-actin control.
Figure 5
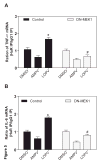
Figure 5. Effects of overexpression of DN-MEK1 on HIV PI-induced increase of binding of HuR to TNF-α and IL-6 mRNAs in mouse macrophages
Mouse J774A.1 cells were infected with CMV control adenovirus or a recombinant DN-MEK1 adenovirus for 24 h and then treated with DMSO, amprenavir (AMPV, 15 μM), or lopinavir (LOPV, 15 μM) for 24 h. Total cell lysates are prepared and subjected to immunoprecipitation (IP) using either anti-HuR antibody or an isotype-matched control IgG1. mRNA levels of TNF-α and IL-6 in the IP material were detected by real-time RT-PCR using gene specific primers as described in “Methods” and expressed as relative ration of mRNA in HuR IP over IgG1 IP. Values are mean ± SE of 3 independent experiments. *p< 0.05, statistical significance relative to vehicle control, DMSO. #p<0.05, statistical significance of the same HIV PI treatment between control group and DN-MEK1 group.
Figure 6
Figure 6. Effect of over-expression of dominant negative mutant of MEK1 on HIV PI-induced UPR activation in macrophages
Mouse J774A.1 cells were infected with a recombinant adenovirus expressing a dominant-negative mutant MEK1 (DN-MEK1) or CMV control virus. After 24 h, cells were treated with individual HIV PIs (15 μM), amprenavir (AMPV), lopinavir (LOPV) or vehicle control (DMSO) for 24 h. Total cell lysates were prepared as described in “Methods”. Three independent experiments were performed. Representative immunoblots against CHOP and β-actin from each treatment group are shown.
Figure 7
Figure 7. Effect of CHOP knock out on HIV PI-induced ERK activation and expression of TNF-α and IL-6 in primary mouse macrophages
(A). Representative immunoblot images from three independent experiments against p-ERK and T-ERK from mouse primary peritoneal macrophages isolated from wild type (WT) and CHOP knock out (CHOP/) and treated with vehicle control (DMSO), amprenavir (AMPV, 15 μM) or lopinavir (LOPV, 15 μM) for 24 h. The density of the immunoreactive bands was analyzed using Image J software. Relative density of p-ERK is shown. (B–C). Effect of CHOP/ on HIV PI-induced TNF-α and IL-6 expression. Mouse primary peritoneal macrophages isolated from WT and CHOP/ were treated with vehicle control (DMSO), amprenavir (AMPV, 15 μM) or lopinavir (LOPV, 15 μM) for 24 h. At the end of treatment, the culture media and cells were collected separately. The amounts of TNF-α and IL-6 released to the media were analyzed by ELISA and normalized to the total protein amounts of the viable cell pellets as described in “Methods”. Values are mean ± SE of 3 independent experiments. *p<0.05, statistical significance relative to DMSO control within each group; #p<0.05, statistical significance of the same treatment between WT and CHOP/ groups.

Similar articles

Cited by

References

    1. Flexner C. HIV-protease inhibitors. NEnglJMed. 1998;338:1281–92. - PubMed
    1. Bruno R, Sacchi P, Maiocchi L, Patruno S, Filice G. Hepatotoxicity and antiretroviral therapy with protease inhibitors: A review. DigLiver Dis. 2006;38:363–73. - PubMed
    1. Calza L, Manfredi R, Chiodo F. Dyslipidaemia associated with antiretroviral therapy in HIV-infected patients. JAntimicrobChemother. 2004;53:10–4. - PubMed
    1. Martinez E, Domingo P, Galindo MJ, Milinkovic A, Arroyo JA, Baldovi F, et al. Risk of metabolic abnormalities in patients infected with HIV receiving antiretroviral therapy that contains lopinavir-ritonavir. ClinInfectDis. 2004;38:1017–23. - PubMed
    1. Nolan D, Watts GF, Herrmann SE, French MA, John M, Mallal S. Endothelial function in HIV-infected patients receiving protease inhibitor therapy: does immune competence affect cardiovascular risk? QJM. 2003;96:825–32. - PubMed

Publication types

MeSH terms