. 2009 Aug 24;202(1):130-7.
doi: 10.1016/j.bbr.2009.03.022. Epub 2009 Mar 28.

Force-plate quantification of progressive behavioral deficits in the R6/2 mouse model of Huntington's disease

Affiliations

Force-plate quantification of progressive behavioral deficits in the R6/2 mouse model of Huntington's disease

Stephen C Fowler et al. Behav Brain Res. .

Abstract

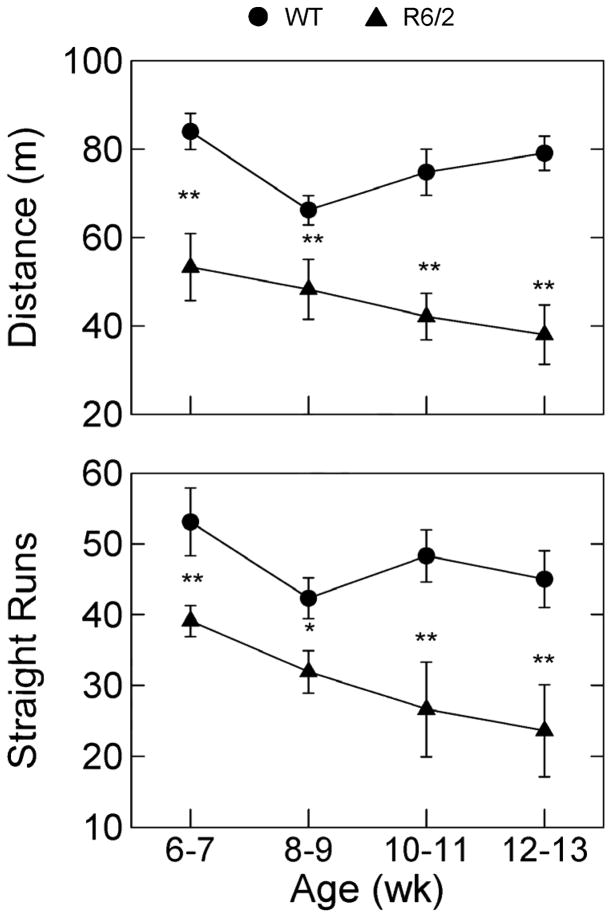
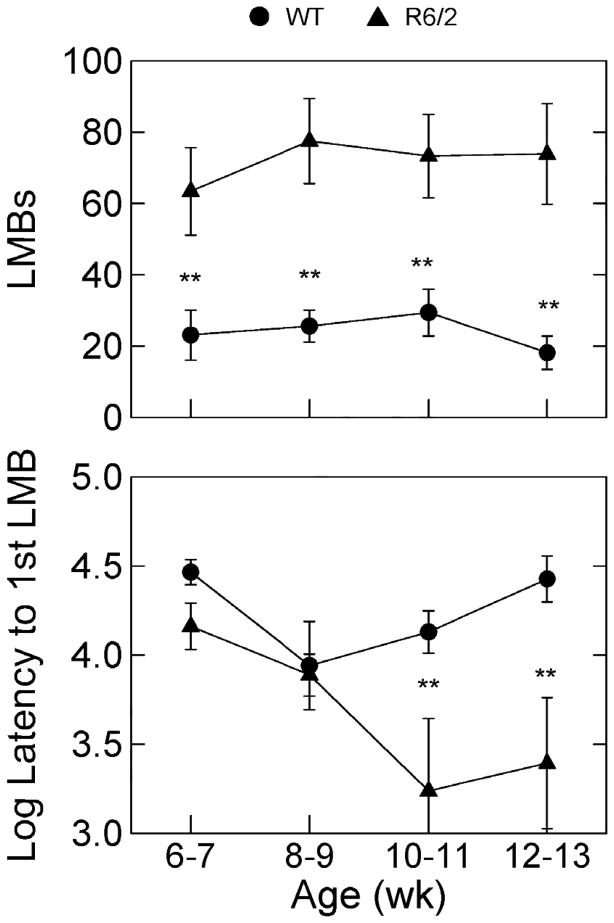
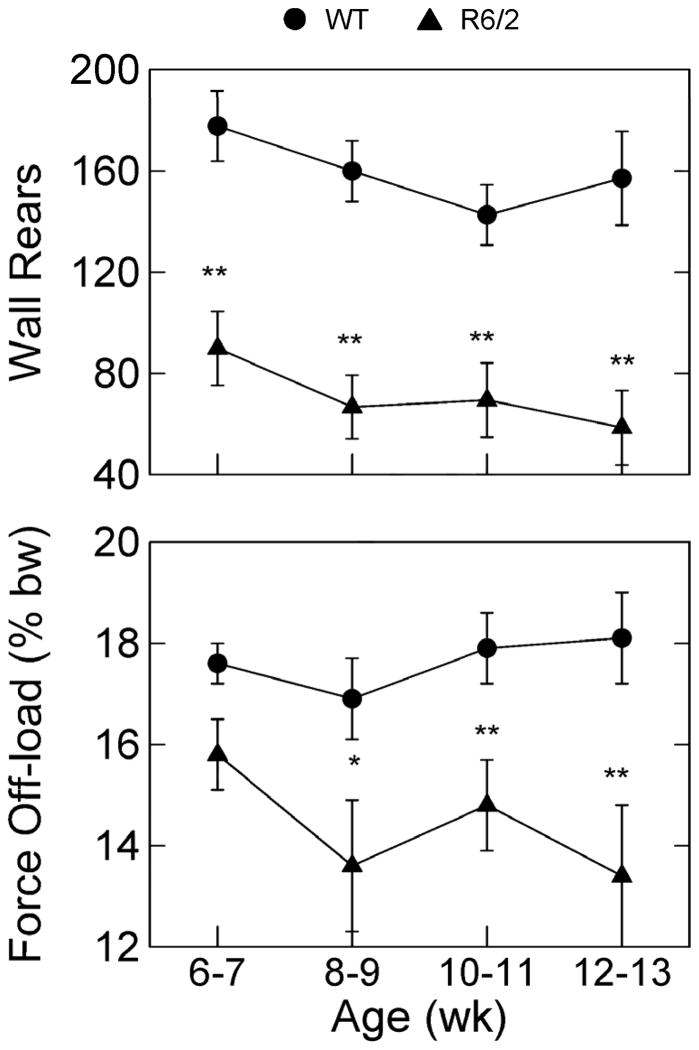
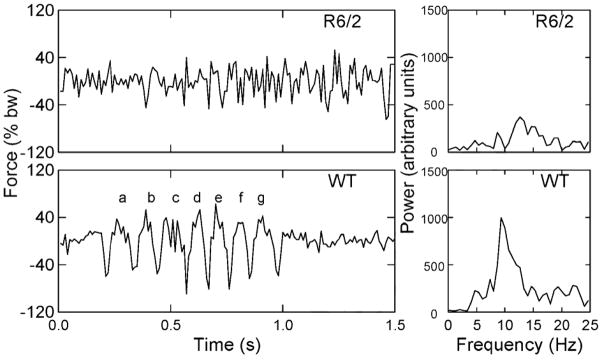
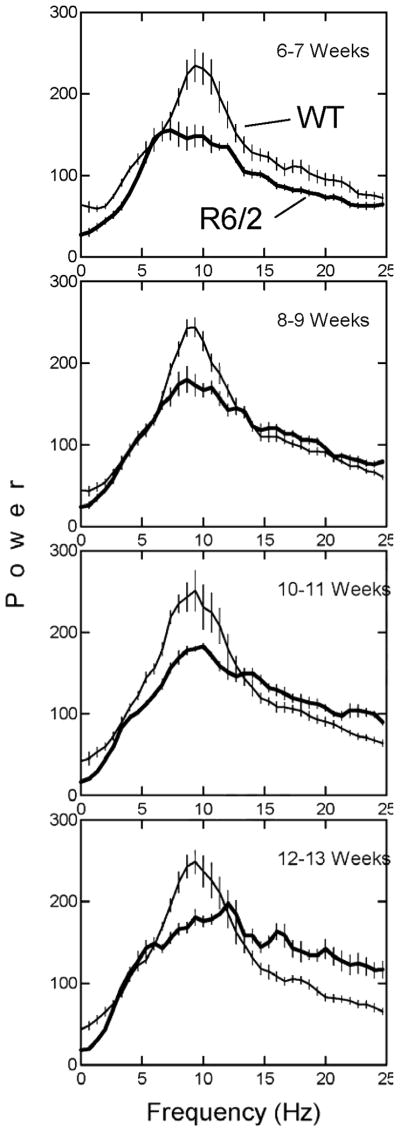
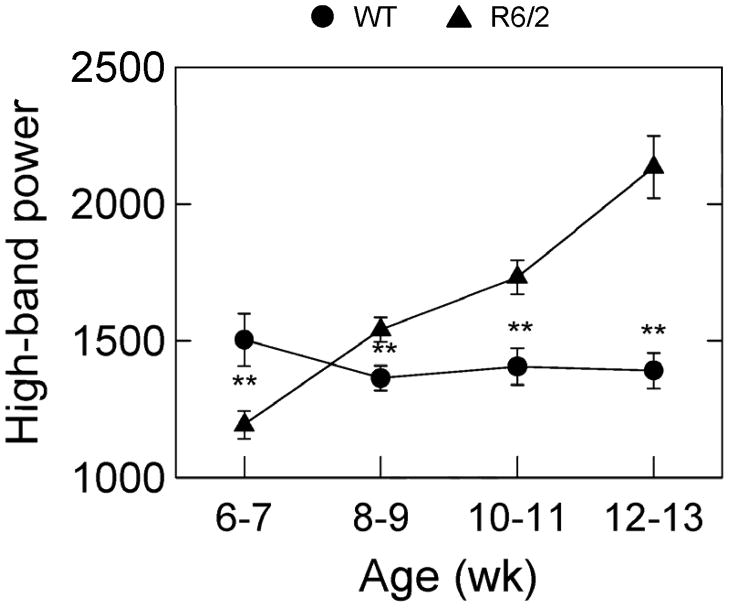
The R6/2 mouse is a popular model of Huntington's disease (HD) because of its rapid progression and measurable behavioral phenotype. Yet current behavioral phenotyping methods are usually univariate (e.g., latency to fall from a rotarod) and labor intensive. We used a force-plate actometer and specialized computer algorithms to partition the data into topographically specific behavioral categories that were sensitive to HD-like abnormalities. Seven R6/2 male mice and 7 wild-type (WT) controls were placed in a 42 cm x 42 cm force-plate actometer for 20-min recording sessions at 6-7, 8-9, 10-11 and 12-13 weeks of age. Distance traveled, number of wall rears, and number of straight runs (traveling 175 mm or more in 1.5s) were reduced in R6/2 relative to WT mice at all ages tested. Low mobility bouts (each defined as remaining continuously in a virtual circle of 15 mm radius for 5s) were increased in R6/2 mice at 6-7 weeks and beyond. Independent of body weight, force off-load during wall rears was reduced in R6/2 mice except at 6-7 weeks. Power spectra of force variation during straight runs indicated an age-related progressive loss of rhythmicity in R6/2 compared to WT, suggesting gait dysrhythmia and dysmetria. Collectively, these data, which extend results obtained with other widely different behavioral phenotyping methods, document a multifaceted syndrome of motor abnormalities in R6/2 mice. We suggest, moreover, that the force-plate actometer offers a high-throughput tool for screening drugs that may affect symptom expression in R6/2 or other HD model mice.


Figures

Figure 1
Figure 1
Group mean distance traveled (top set of axes) and mean number of straight runs exhibited by R6/2 (n=7) and WT (n=7) mice during 20-min recordings sessions a four different ages. Brackets indicate ± 1 SEM; * and ** denote p<.05 and p<.01, respectively. See methods for details on how straight runs were defined.
Figure 2
Figure 2
Group mean number of low mobility bouts (LMB) and mean log10 latency (bottom panel) to the occurrence of the first LMB in the recording session. Latency was recorded in 0.01 s units; thus, 4.0 on the ordinate of log10 latencies reprsents 10,000 units or 100 s. See Fig. 1 caption for labeling conventions.
Figure 3
Figure 3
Group mean number of wall rears and the corresponding mean off-load force during wall rears at the indicated ages of testing. % bw indicates that force was expressed as percent of each mouse’s body weight. See Fig. 1 caption for labeling conventions.
Figure 4
Figure 4
Time series of vertical force and corresponding power spectra of two approximately equal-distance straight runs executed in 1.5 s. by an R6/2 and a WT mouse at 12–13 weeks of age. The force data were expressed as a percent of body weight (% bw), thereby making the amplitude of force variation independent of body weight. The lower case letters on the face of the WT time series graph label consecutive half strides during this run. At “a” two diagonally opposite feet (e.g., left front, right rear) strike the load plate simultaneously and also push off together; at “b”, the other two diagonally opposite feet (right front, left rear) strike and push off together. Force variations at “a” and “b” thus represent one stride.
Figure 5
Figure 5
Group mean power spectra for vertical force variation during runs for R6/2 (thick lines) and WT mice (thin lines). Thin vertical lines indicate ± 1 SEM for each elementary frequency band in the spectrum.
Figure 6
Figure 6
Integrated power in the 15–25 Hz band of the power spectrum of force variations of runs (bouts of brief but relatively fast, straight ambulations) for R6/2 mice and WT controls tested in a force plate actometer at the indicated ages. Brackets indicate ± 1 SEM, and ** denote p<.01.

References

    1. Aziz NA, van der Burg JM, Landwehrmeyer GB, Brundin P, Stijnen T, Roos RA EHDI StudyGroup. Weight loss in Huntington disease increases with higher CAG repeat number. Neurology. 2008;71:1506–13. - PubMed
    1. Baik JH, Picetti R, Saiardi A, Thiriet G, Dierich A, Depaulis A, Le Meur M, Borrelli E. Parkinsonian-like locomotor impairment in mice lacking dopamine D2 receptors. Nature. 1995;377:424–428. - PubMed
    1. Carter RJ, Lione LA, Humby T, Mangiarini L, Mahal A, Bates GP, Dunnett SB, Morton AJ. Characterization of progressive motor deficits in mice transgenic for the human Huntington’s disease mutation. J Neurosci. 1999;19:3248–3257. - PMC - PubMed
    1. Clarke KA, Smart L, Still J. Ground reaction force and spatiotemporal measurements of the gait of the mouse. Behav Res Methods Instrum Comput. 2001;33:422–426. - PubMed
    1. Dragatsis I, Goldowitz D, Del Mar N, Deng YP, Meade CA, Liu L, Sun Z, Dietrich P, Yue J, Reiner A. CAG repeat lengths >/=335 attenuate the phenotype in the R6/2 Huntington’s disease transgenic mouse. Neurobiol Dis. 2008 Nov 6; Epub ahead of print. - PMC - PubMed

Publication types

MeSH terms