. 2009 Jul;46(11-12):2403-12.
doi: 10.1016/j.molimm.2009.04.019. Epub 2009 May 17.

Spatial distribution, kinetics, signaling and cytokine production during homeostasis driven proliferation of CD4+ T cells

Affiliations

Spatial distribution, kinetics, signaling and cytokine production during homeostasis driven proliferation of CD4+ T cells

Deepak Sharma et al. Mol Immunol. 2009 Jul.

Abstract

During recovery from lymphopenia, the naïve T-cells undergo homeostasis driven proliferation (HDP) and acquire a memory phenotype. The HDP of T-cells requires signals derived from T-cell-receptor, p56lck kinase, IL-7R and IL-15R. However, the role of other signaling molecules during HDP of CD4+ T-cells remains speculative. The differentiation of naïve T-cells into Th1/Th2/Th17 or Treg populations during HDP is not well understood. Present report describes the spatial and signaling characteristics of HDP of CD4+ T-cells and their cytokine profiles. The HDP of CD4+ T-cells was found to occur only in specific areas (T-cell zones) of secondary lymphoid organs of lymphopenic mice. The inhibitors of MEK and PKC and their combination with inhibitors of PI3kinase and mTOR suppressed mitogen induced T-cell proliferation without affecting their HDP. The CD4+ T-cells taken from reconstituted lymphopenic mice showed activation of proteins involved in NF-kappaB pathway, significantly higher production of pro-inflammatory cytokine IL-6, and lower production of IL-4 as compared to T-cells from normal mice. Plumbagin, a known NF-kappaB blocker inhibited survival as well as HDP of CD4+ T-cells and IL-6 production in activated T-cells. Our results demonstrate the essential role of NF-kappaB during HDP of T-cells.


Figures

Fig. 1
Fig. 1
Kinetics of mitogen driven proliferation of T cells in vitro vis a vis homeostasis driven proliferation (HDP) of CD4+ T cells in vivo: CD4+ T cells or total lymphocytes were stained with CFSE. Lymphocytes (2 × 10⁶ cells) were stimulated with con A in vitro for 72 h. Alternatively, 1.5 × 10⁶ CD4+ T cells were injected i.v. into tail vain of normal or lymphopenic mice. Lymphocytes were recovered from spleen of the host mice 96 h after reconstitution and 50,000 cells were acquired in FACS. (A) Representative dot plots and (B) percent daughter cells in each treatment group as estimated from decrease in mean fluorescence intensity. (C) Representative flowcytometric dot plots of CFSE labeled cells showing HDP of CD4+ T cells in lymphopenic mice. (D) The bars represent frequency of daughter cells in different division cycles in each treatment group. Data points represent mean ± S.E.M. for four mice and three such experiments were carried out. *p < 0.01, as compared to cells injected in normal mice. *p < 0.01, as compared to unstimulated cells.
Fig. 2
Fig. 2
HDP of CD4+ T cells in secondary lymphoid organs: Purified CD4+ T cells were stained with CFSE and 2 × 10⁶ cells were injected i.v. or i.p. into normal and lymphopenic mice. Lymphocytes were recovered from spleen, lymph node and peritoneum of the host mice 96 h after injection and 50,000 cells were acquired in FACS. Percent daughter cells were calculated from decrease in mean fluorescence intensity. (A) The bars represent percent daughter cells in the donor cell population isolated from different anatomical sites of the host. Data points represent mean ± S.E.M. for four mice and two such experiments were carried out. *p < 0.01, as compared to cells injected in normal mice. (B) T cell zones in a normal spleen: transverse sections (20 μm) of fresh frozen spleen were mounted on glass slides and stained with PE conjugated CD3 antibody and observed under fluorescence microscope. Shown are the T cell zones in a spleen isolated from a normal mouse. Right panel shows higher magnification images of individual T cell zones. (C) T cells undergoing HDP formed T cell zones in spleen of a lymphopenic mouse. Purified CD4+ T cells from BALB/c mice were stained with CFSE and 2 × 10⁶ cells were injected i.v. into lymphopenic BALB/c mice. Spleens from the host were harvested 96 h after injection and frozen in liquid nitrogen. Transverse sections (20 μm) of fresh frozen spleen were mounted on glass slides and stained with PE conjugated CD3 antibody and observed under fluorescence microscope. Overlaid pictures show homing of the CFSE+ cells to the T cell zones of the host. Sections from two spleens are shown.
Fig. 3
Fig. 3
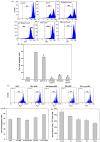
Differential modulation of MDP and HDP of T cells by MEK inhibitor PD98059 or PKC inhibitor Gö6983 or their combination with rapamycin and PI3Kinase inhibitor Ly294002: Splenic lymphocytes were stained with CFSE and treated with PD98059 (50 μM) or Gö6983 (25 nM) or PD98059 (50 μM) + Ly294002 (20 μM) or Gö6983 (25 nM) + rapamycin (10 nM) and were stimulated with Con A (10 μg/ml) at 37 °C in CM in a 95% air/5% CO2 atmosphere for 72 h. In each group 20,000 cells were acquired in FACS. (A) Representative flowcytometric histograms showing proliferation of T cells. (B) Purified CD4+ T cells were stained with CFSE and cultured in presence of PD98059 or Gö6983 or PD98059 + Ly294002 or Gö6983 + rapamycin overnight and 2 × 10⁶ cells were injected i.v. into lymphopenic mice. Lymphocytes were recovered from spleen of the host mice 96 h after injection and 50,000 cells were acquired in FACS. Representative flowcytometric histograms show proliferation of CFSE+ CD4+ T cells. (C) Percent daughter cells in response to con A in each treatment group. (D) The bars represent percentage of donor derived daughter cells in the spleen of lymphopenic host. (E) Frequency of donor cells in the host spleen. Data points represent mean ± S.E.M. from three replicates in vitro and four mice in vivo and two such experiments were carried out. #p < 0.01 as compared to Con A treated cells (MDP). *p < 0.01 as compared to untreated cells injected into lymphopenic mice.
Fig. 4
Fig. 4
Activation of NF-κB during HDP of CD4+ T cells and modulation by plumbagin (A) Purified CD4+ T cells were injected i.v. into lymphopenic mice and were recovered from host spleen 4 days after injection. CD4+ T cells were sorted and used for analysis of IκB-α, phospho AKT, phospho JNK and actin-β using western blotting. (B) Purified CD4+ T cells were stained with CFSE and cultured in presence of plumbagin (5 μM) for 4 h and 2 × 10⁶ cells were injected i.v. into lymphopenic mice. Lymphocytes were recovered from spleen of the host mice 96 h after injection and 50,000 cells were acquired in FACS. Representative flowcytometric histograms and dot plots show proliferation of CFSE+ CD4+ T cells. (C) The bars represent frequency of donor cells in the host spleen. Data points represent mean ± S.E.M. from three replicates in vitro and four mice in vivo and two such experiments were carried out. *p < 0.01, as compared to that in untreated cells injected into lymphopenic mice.
Fig. 5
Fig. 5
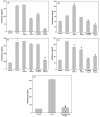
Changes in cytokine production by lymphocytes during recovery from lymphopenia. Lymphopenic mice were reconstituted with autologous CD4+ T cells and sacrificed 4, 19 and 100 days after adoptive transfer. The splenic lymphocytes from mice recovering from lymphopenia and age/sex matched normal mice were cultured in presence of con A (10 μg/ml) at 37 °C in CM in a 95% air/5% CO2 atmosphere for 24 h. The levels of (A) IL-2, (B) IL-4, (C) IL-6 and (D) IFN-γ in the culture supernatants of cells obtained from BALB/c mice and (E) the levels of IL-6 in the culture supernatants of cells obtained from Swiss mice were estimated by ELISA. #p < 0.01, as compared to that in Con A stimulated cells from normal mice.
Fig. 6
Fig. 6
Modulation of cytokine production by Gö6983, PD98059, Ly294002, rapamycin and plumbagin in Con A stimulated lymphocytes: Lymphocytes from BALB/c mice were treated with Go6982 (25 nM) or PD98059 (50 μM) or a combination of (Gö6983, 25 nM + Rapamycin 10 nM) or (PD98059, 50 μM + Ly294002, 20 μM). Another set of lymphocytes was treated with plumbagin (5 μM) in RPMI medium free from 2-mercaptoethanol and 2 × 10⁶ cells were stimulated with Con A (10 μg/ml) at 37 °C in CM in a 95% air/5% CO2 atmosphere for 24 h. Unstimulated cells were used as control. The levels of (A) IL-2, (B) IL-4, (C and E) IL-6 and (D) IFN-γ in the culture supernatant were estimated by ELISA. #p < 0.01, as compared to that in Con A treated cells.

Similar articles

Cited by

References

    1. Agrawal A, Dillon S, Denning TL, Pulendran B. ERK1−/− mice exhibit Th1 cell polarization and increased susceptibility to experimental autoimmune encephalomyelitis. J Immunol. 2006;176:5788–5796. - PubMed
    1. Baccala R, Theofilopoulos AN. The new paradigm of T-cell homeostatic proliferation-induced autoimmunity. Trends Immunol. 2005;26:5–8. - PubMed
    1. Baier G, Telford D, Giampa L, Coggeshall KM, Baier-Bitterlich G, Isakov N, Altman A. Molecular cloning and characterization of PKC theta, a novel member of the protein kinase C (PKC) gene family expressed predominantly in hematopoietic cells. J Biol Chem. 1993;268:4997–5004. - PubMed
    1. Calzascia T, Pellegrini M, Lin A, Garza KM, Elford AR, Shahinian A, Ohashi PS, Mak TW. CD4 T cells, lymphopenia, and IL-7 in a multistep pathway to autoimmunity. Proc Natl Acad Sci U S A. 2008;105:2999–3004. - PMC - PubMed
    1. Ernst B, Lee DS, Chang JM, Sprent J, Surh CD. The peptide ligands mediating positive selection in the thymus control T cell survival and homeostatic proliferation in the periphery. Immunity. 1999;11:173–181. - PubMed

MeSH terms