. 2009 Aug;182(4):1015-33.
doi: 10.1534/genetics.109.103614. Epub 2009 May 17.

The cation diffusion facilitator gene cdf-2 mediates zinc metabolism in Caenorhabditis elegans

Affiliations

The cation diffusion facilitator gene cdf-2 mediates zinc metabolism in Caenorhabditis elegans

Diana E Davis et al. Genetics. 2009 Aug.

Abstract

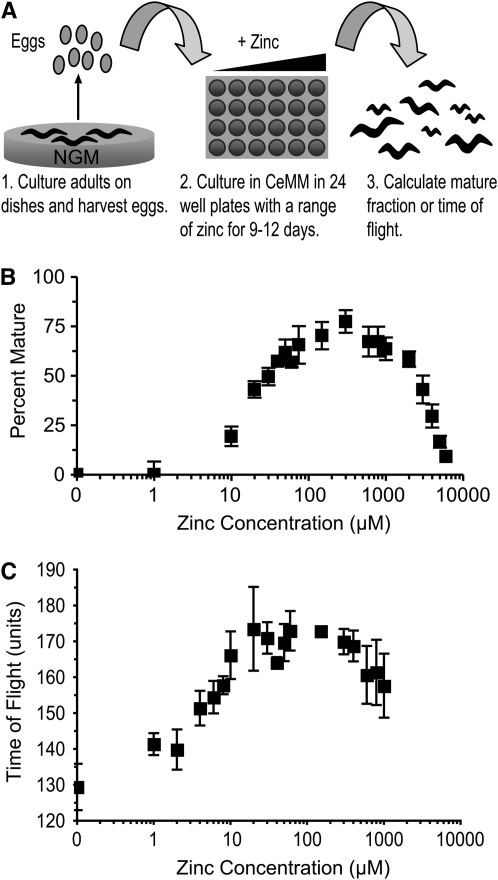
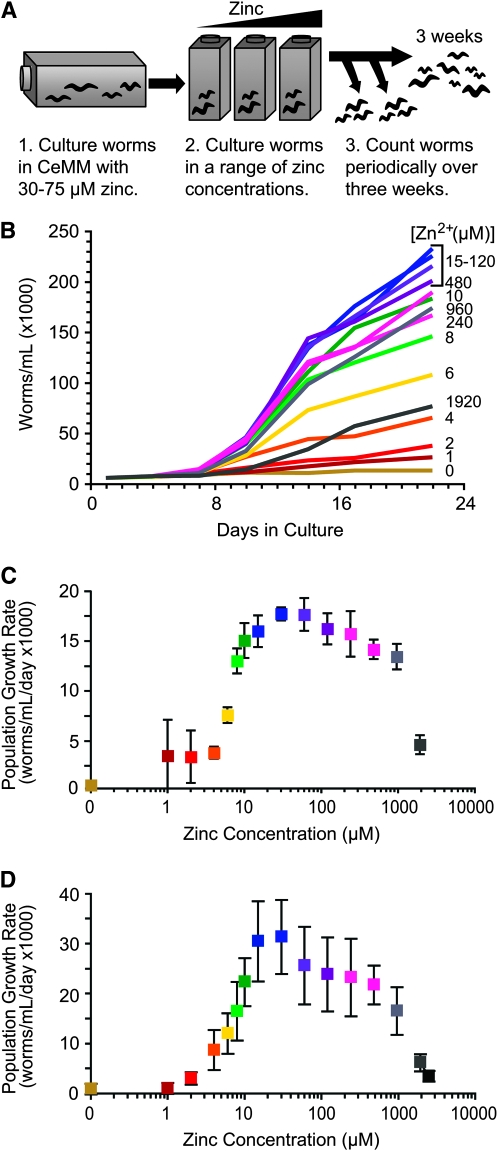
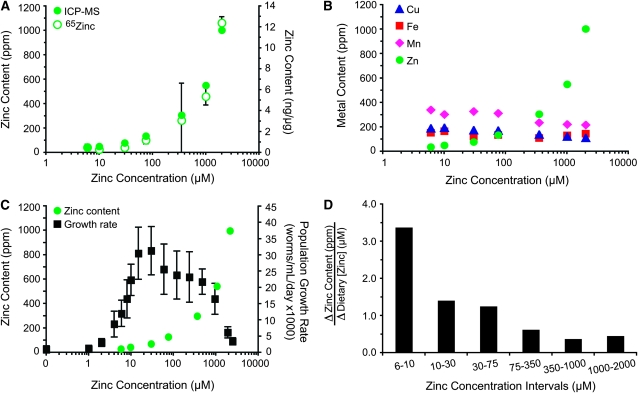
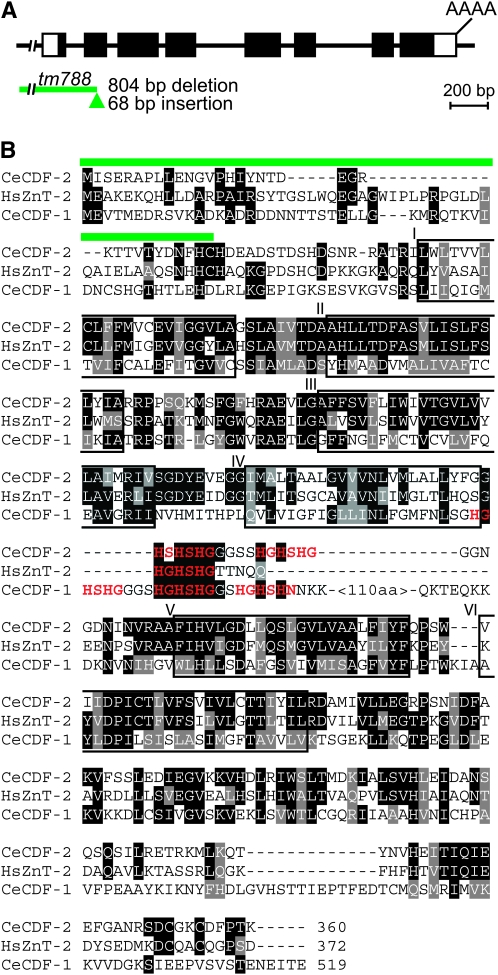
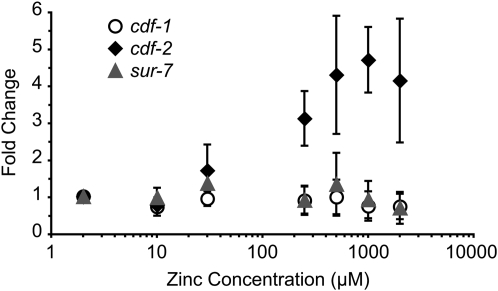
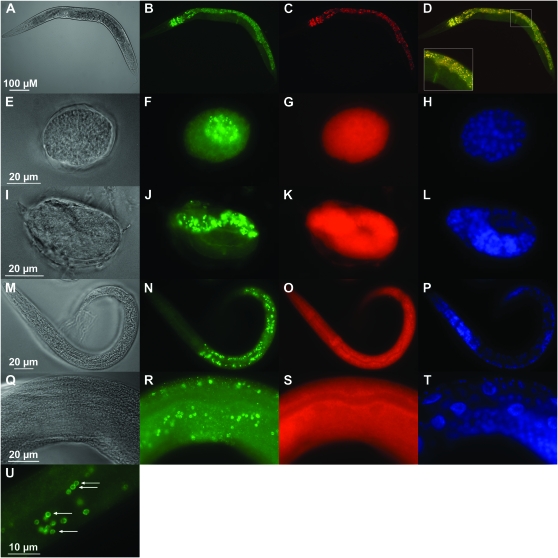
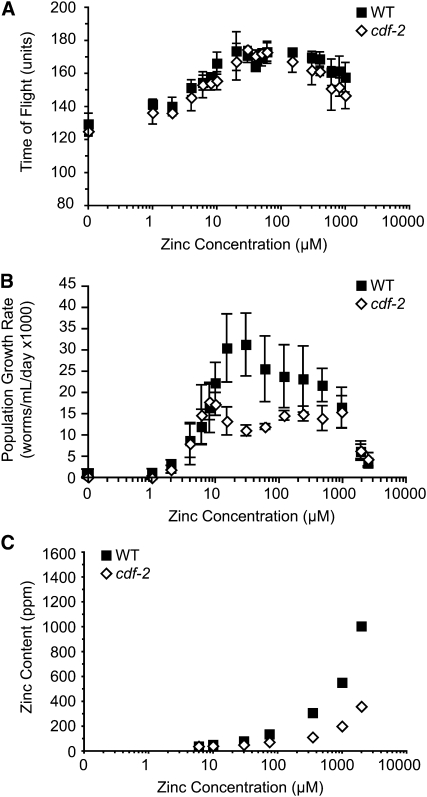
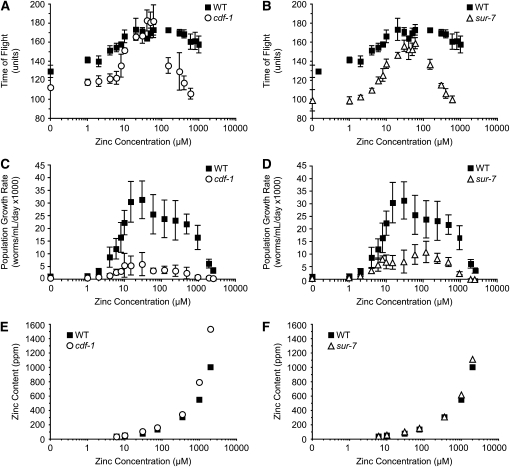
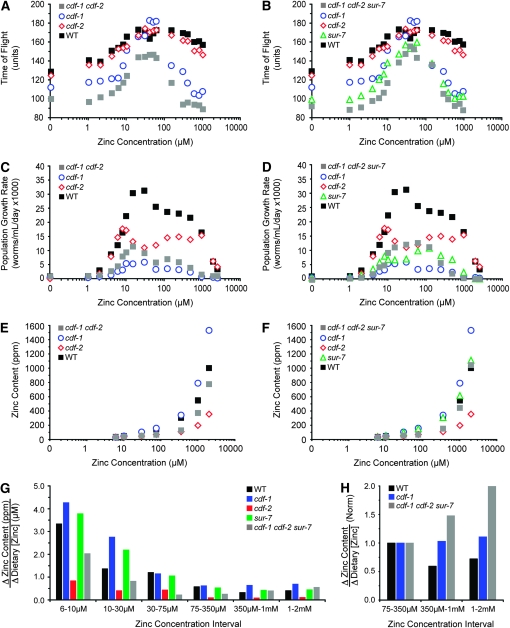
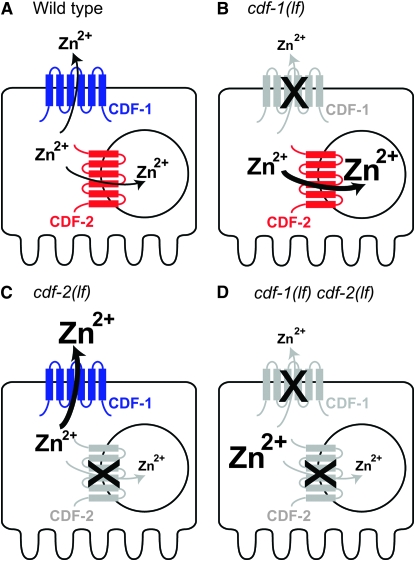
Zinc is essential for many cellular processes. To use Caenorhabditis elegans to study zinc metabolism, we developed culture conditions allowing full control of dietary zinc and methods to measure zinc content of animals. Dietary zinc dramatically affected growth and zinc content; wild-type worms survived from 7 microm to 1.3 mm dietary zinc, and zinc content varied 27-fold. We investigated cdf-2, which encodes a predicted zinc transporter in the cation diffusion facilitator family. cdf-2 mRNA levels were increased by high dietary zinc, suggesting cdf-2 promotes zinc homeostasis. CDF-2 protein was expressed in intestinal cells and localized to cytosolic vesicles. A cdf-2 loss-of-function mutant displayed impaired growth and reduced zinc content, indicating that CDF-2 stores zinc by transport into the lumen of vesicles. The relationships between three cdf genes, cdf-1, cdf-2, and sur-7, were analyzed in double and triple mutant animals. A cdf-1 mutant displayed increased zinc content, whereas a cdf-1 cdf-2 double mutant had intermediate zinc content, suggesting cdf-1 and cdf-2 have antagonistic functions. These studies advance C. elegans as a model of zinc metabolism and identify cdf-2 as a new gene that has a critical role in zinc storage.


Figures

F<sc>igure</sc> 1.—
Figure 1.—
The maturation of wild-type worms is affected by dietary zinc. (A) To monitor maturation, we cultured adults on NGM with live E. coli, transferred eggs or L1 larvae to CeMM (18–19 different zinc concentrations) in 24-well plates, cultured for 9–12 days, and evaluated maturation using a dissecting microscope (B) or a COPAS Biosort (C). (B) Wild-type worms were cultured in CeMM with added zinc, displayed on a logarithmic scale. To calculate the percentage of eggs that matured to an adult, we counted immature and mature animals and calculated the percentage of mature animals. (C) Maturation was monitored using the COPAS Biosort to measure time of flight (TOF). TOF is a measure of the time that the animal blocks light transmission and is shown in arbitrary units. The TOF value of animals at the beginning of the experiment was ∼80 units. Values are the average (± standard deviation, SD) of four biological replicates.
F<sc>igure</sc> 2.—
Figure 2.—
The population growth rate of wild-type worms is affected by dietary zinc. (A) To monitor the growth rate of the population, we cultured worms in CeMM with 30–75 μm zinc for multiple generations, transferred worms to flasks of CeMM (15–16 different zinc concentrations), and counted the number of worms per milliliter of culture medium at multiple times. Counting was performed using a dissecting microscope (B and C) or a COPAS Biosort (D). (B) Wild-type worms were cultured in CeMM with different concentrations of added zinc shown in micromolars and indicated by colored lines. The numbers of worms per milliliter were determined at culture days 1, 4, 7, 10, 14, 17, and 22. The increase in population was maximal and approximately linear between days 7 and 17. (C) The slopes of the lines defined by the linear range shown in B were used to calculate population growth rates in worms/ml/day. The concentration of added zinc is displayed on a logarithmic scale. The colors of the data points correspond to the colors of the lines shown in B. Values are the average (±SD) of three independent experiments, one of which is shown in B. (D) Population growth rate was monitored using the COPAS Biosort to measure the number of animals at four time points between days 9 and 17. Values are the average (±SD) of three independent experiments. The growth rates calculated from the COPAS Biosort data are somewhat higher than the growth rates calculated from the dissecting microscope data, probably because human observers are more stringent than the instrument in scoring an object as a worm. Nonetheless, the effect of zinc on population growth rate was similar when measured using a dissecting microscope or the COPAS Biosort.
F<sc>igure</sc> 3.—
Figure 3.—
Zinc content of mixed-stage wild-type animals. Worms were cultured in CeMM with a range of added zinc, shown on a logarithmic scale. (A) The zinc content was determined by ICP-MS (ppm, closed green circles), or radiolabeled 65Zn (average ng zinc/μg protein ± SD, n = 2, open green circles) in independent experiments. (B) ICP-MS was used to measure the content of copper (Cu, blue triangles), iron (Fe, red squares), manganese (Mn, pink diamonds), and zinc (Zn, green circles) of each sample. The dietary concentrations of copper, iron, and manganese in CeMM were 37.5 μm, 150 μm, and 112.5 μm, respectively, in all the samples. (C) Zinc content was determined by ICP-MS (green circles), and population growth rate was determined by COPAS Biosort (black squares) in independent experiments. (D) Bars indicate the change in zinc content (ppm) divided by the change in dietary zinc (μm) for the two dietary zinc concentrations shown below. Values are the slope of the line defined by the ICP-MS data in A.
F<sc>igure</sc> 4.—
Figure 4.—
cdf-2 gene structure and predicted amino acid sequence. (A) The line represents genomic DNA, and boxes represent exons that are untranslated (white) or translated (black). The green line indicates the extent of the tm788 deletion, and the green triangle denotes the tm788 insertion. (B) An alignment of the predicted CDF-2 protein with human ZnT-2 and C. elegans CDF-1. Identical and similar amino acids are highlighted in black and gray, respectively. Green lines indicate codons deleted in the tm788 allele. Putative zinc binding motifs, (HX)n, are red. Predicted transmembrane segments are boxed and labeled I–VI.
F<sc>igure</sc> 5.—
Figure 5.—
cdf-2 transcript abundance was regulated by dietary zinc. Wild-type animals were cultured in CeMM with added zinc, shown on a logarithmic scale. The abundance of transcripts from cdf-1 (open circles), cdf-2 (solid diamonds), and sur-7 (shaded triangles) was measured by performing quantitative, real-time PCR. The axis represents the fold change in transcript abundance, which was calculated by comparing the transcript abundance at 2 μm, 10 μm, 30 μm, 250 μm, 500 μm, 1 mm, and 2 mm dietary zinc to transcript abundance at 2 μm dietary zinc. Values for transcript abundance were corrected for RNA recovery and the efficiency of primer amplification (see materials and methods). The fold change of each gene at 2 μm zinc was set equal to 1.0, and other values were normalized relative to 2 μm zinc. Values are the average of four independent replicates (±SD). Compared to transcript abundance at 2 μm zinc, cdf-2 transcripts were significantly higher at zinc concentrations of 250 μm to 2 mm zinc (approximately three- to fourfold, P < 0.05, Welch's t-test), whereas cdf-1 and sur-7 transcripts were significantly decreased at 2 mm zinc (approximately twofold, P < 0.05, Welch's t-test).
F<sc>igure</sc> 6.—
Figure 6.—
CDF-2 was expressed in intestinal cells and localized to membrane-bound vesicles. Transgenic animals expressing CDF-2∷GFP were cultured on NGM with live E. coli. Live adults were immobilized and mounted (A–D). The inset in D is a 2.4× magnification of the boxed region. Mixed-stage worms were fixed and stained with an anti-GFP antibody (E–U). Differential interference contrast images display organism morphology (A, E, I, M, and Q), green displays CDF-2∷GFP and autofluorescence (B) or only CDF-2∷GFP (F, J, N, R, and U), red displays autofluorescence (C, G, K, O, and S), yellow displays overlap between CDF-2∷GFP and autofluorescence (D), and blue displays nuclear morphology using DAPI (H, L, P, and T). Red in C shows a punctate pattern of autofluorescence in intestinal cells, whereas red in G, K, O, and S shows that there is no specific localization of autofluorescence following fixation, and exposure times for red in these panels were at least fivefold longer than for green. CDF-2∷GFP was first detected during embryogenesis at the E16–E20 stage (F), and expression persisted throughout embryogenesis (J). CDF-2∷GFP was expressed in a punctate pattern in intestinal cells during all larval stages (N) and in adults (R). Puncta appear to be membrane-bound vesicles (arrows in U).
F<sc>igure</sc> 7.—
Figure 7.—
cdf-2 mutant phenotypes. Wild-type and mutant animals were cultured in CeMM with a range of added zinc, shown on a logarithmic scale. (A) Maturation of wild type (WT, solid squares) and cdf-2(tm788) (open diamonds) was monitored using the COPAS Biosort. Values are the average (±SD) of four biological replicates and are representative of two independent experiments. (B) Population growth rate was monitored using the COPAS Biosort, and values are the average (±SD) of two to three independent experiments. (C) Zinc content was measured using ICP-MS.
F<sc>igure</sc> 8.—
Figure 8.—
Maturation, population growth rate, and zinc content of cdf-1 and sur-7 mutant animals. Wild-type and mutant animals were cultured in CeMM with a range of added zinc, shown on a logarithmic scale. (A and B) Maturation of wild type (WT, solid squares), cdf-1(n2527) (open circles), and sur-7(ku119) (open triangles) was monitored using the COPAS Biosort. Values are the average (±SD) of four biological replicates and are representative of two independent experiments. (C and D) Population growth rate was monitored using the COPAS Biosort, and values are the average (±SD) of two to three independent experiments. (E and F) Zinc content was measured by ICP-MS.
F<sc>igure</sc> 9.—
Figure 9.—
Maturation, population growth rate, and zinc content of double and triple mutant animals. Wild-type and mutant animals were cultured in CeMM with a range of added zinc, shown on a logarithmic scale. (A and B) Maturation of wild type (black squares), cdf-1(n2527) (open blue circles), cdf-2(tm788) (open red diamonds), sur-7(ku119) (open green triangles), cdf-1(n2527) cdf-2(tm788) (gray squares), and cdf-1(n2527) cdf-2(tm788) sur-7(ku119) (gray squares) was monitored using the COPAS Biosort. Values are the average of four biological replicates. (C and D) Population growth rates were monitored using the COPAS Biosort. Values are the average of two to three independent experiments. Values (±SD) are shown in Table S2 (maturation) and Table S3 (population growth rate). (E–H) Zinc content was measured by ICP-MS. The change in zinc content as a function of change in dietary zinc is displayed in units of ppm/μm (G) or normalized by setting the values for 75–350 μm = 1.0 (H).
F<sc>igure</sc> 10.—
Figure 10.—
A model of zinc distribution in wild-type and cdf mutant animals. Each diagram shows a polarized intestinal cell. CDF-1 (blue) localizes to the plasma membrane, and CDF-2 (red) localizes to the membrane of an intracellular compartment. The absence of CDF-1 and CDF-2 in mutant animals is illustrated by an X (B–D). The size of the Zn2+ indicates the concentration of zinc in a compartment. We propose that CDF-1 and CDF-2 function as zinc transporters on the basis of sequence similarity to well-characterized CDF proteins, and the size of the arrow indicates the amount of zinc flux. (A) In wild-type animals, CDF-1 and CDF-2 compete for cytosolic zinc, resulting in intermediate levels of zinc in the cytosol, the extracellular space, and the vesicle lumen. (B) In cdf-1(lf) mutant animals, the level of cytosolic zinc increases, and CDF-2 transports additional zinc into the vesicle lumen. (C) In cdf-2(lf) mutant animals, the level of cytosolic zinc increases, and CDF-1 transports additional zinc into the extracellular space. (D) In cdf-1(lf) cdf-2(lf) double mutant animals, zinc transport into both the vesicle lumen and extracellular space decreases.

Similar articles

Cited by

References

    1. Andrews, G. K., H. Wang, S. K. Dey and R. D. Palmiter, 2004. Mouse zinc transporter 1 gene provides an essential function during early embryonic development. Genesis 40 74–81. - PubMed
    1. Beitel, G. J., S. G. Clark and H. R. Horvitz, 1990. Caenorhabditis elegans ras gene let-60 acts as a switch in the pathway of vulval induction. Nature 348 503–509. - PubMed
    1. Brenner, S., 1974. The genetics of Caenorhabditis elegans. Genetics 77 71–94. - PMC - PubMed
    1. Bruinsma, J. J., T. Jirakulaporn, A. J. Muslin and K. Kornfeld, 2002. Zinc ions and cation diffusion facilitator proteins regulate Ras-mediated signaling. Dev. Cell 2 567–578. - PubMed
    1. Bruinsma, J. J., D. L. Schneider, D. E. Davis and K. Kornfeld, 2008. Identification of mutations in Caenorhabditis elegans that cause resistance to high levels of dietary zinc and analysis using a genomewide map of single nucleotide polymorphisms scored by pyrosequencing. Genetics 179 811–828. - PMC - PubMed

Publication types

MeSH terms