. 2009 Jun;41(6):724-8.
doi: 10.1038/ng.385. Epub 2009 May 17.

Genome-wide association studies identify loci associated with age at menarche and age at natural menopause

Affiliations

Genome-wide association studies identify loci associated with age at menarche and age at natural menopause

Chunyan He et al. Nat Genet. 2009 Jun.

Abstract

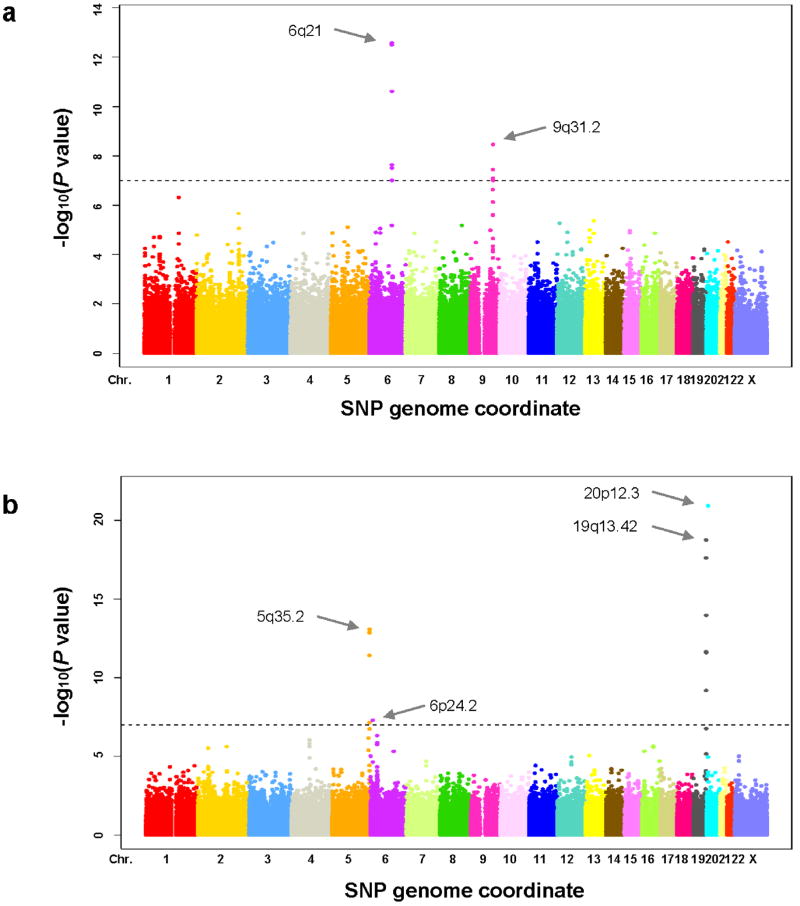
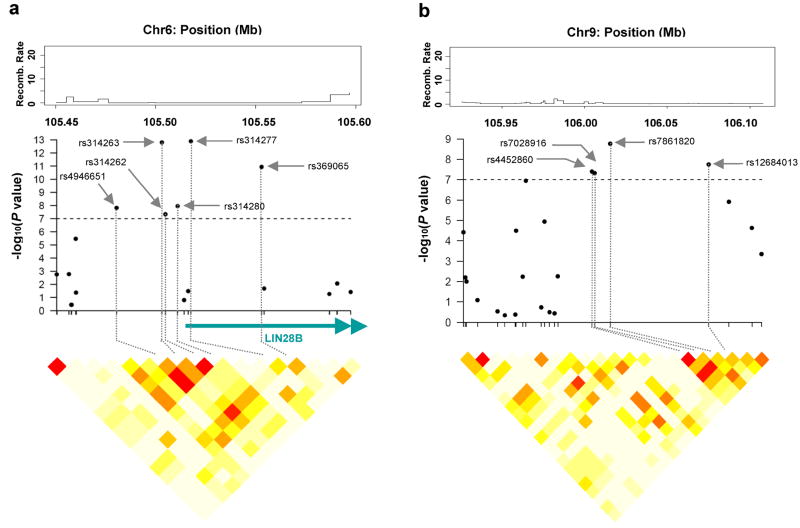
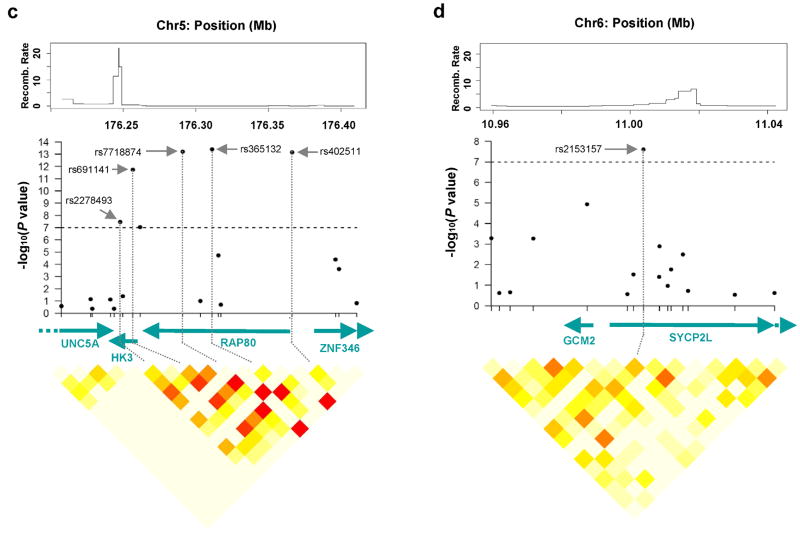
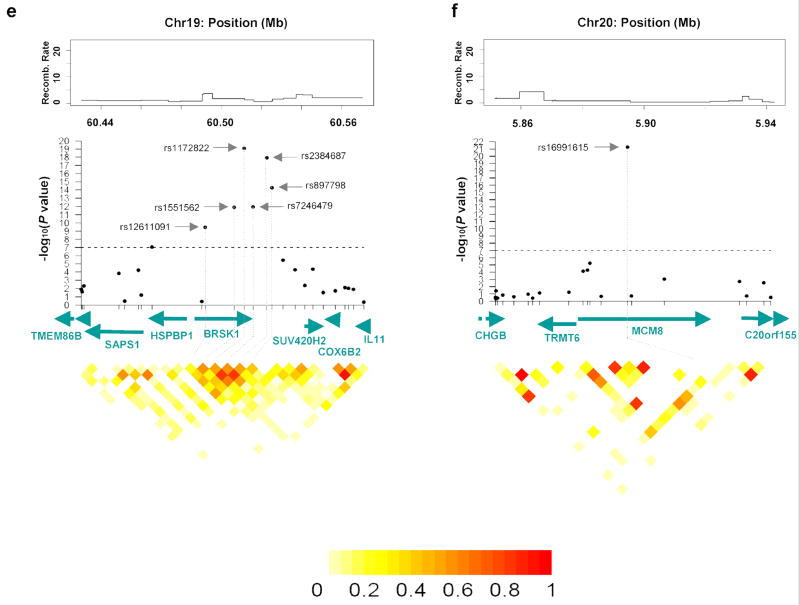
Age at menarche and age at natural menopause are associated with causes of substantial morbidity and mortality such as breast cancer and cardiovascular disease. We conducted a joint analysis of two genome-wide association studies of these two traits in a total of 17,438 women from the Nurses' Health Study (NHS, N = 2,287) and the Women's Genome Health Study (WGHS, N = 15,151). For age at menarche, we identified ten associated SNPs (P = 1 × 10(-7)-3 × 10(-13)) clustered at 6q21 (in or near the gene LIN28B) and 9q31.2 (in an intergenic region). For age at natural menopause, we identified 13 associated SNPs (P = 1 × 10(-7)-1 × 10(-21)) clustered at 20p12.3 (in the gene MCM8), 19q13.42 (in or near the gene BRSK1), 5q35.2 (in or near genes UIMC1 and HK3) and 6p24.2 (in the gene SYCP2L). These newly identified loci might expand understanding of the biological pathways regulating these two traits.


Figures

Figure 1
Figure 1
Manhattan plots for 317,759 single-SNP tests of association in joint analysis with age at menarche (a) and age at natural menopause (b) by SNP position along chromosome. The dotted lines indicate the P value of 1×10⁻⁷ (genome wide significance level).
Figure 2
Figure 2
Regional association analyses for age at menarche (a, b) and age at natural menopause (c, d, e, f) in joint analysis. The upper panels show the recombination rate for these regions estimated from HapMap data and P values for association testing from the joint analysis of two GWA studies in the NHS and the WHS, covering most strongly associated SNPs and approximately 50kb upstream and 50kb downstream. The lower panels show estimates of the square of the correlation coefficient (r2) calculated for each pairwise comparison of SNPs. The r2 values are color coded according to the scale at the bottom. The middle panels show gene name, their direction of transcription and corresponding genome position.
Figure 2
Figure 2
Regional association analyses for age at menarche (a, b) and age at natural menopause (c, d, e, f) in joint analysis. The upper panels show the recombination rate for these regions estimated from HapMap data and P values for association testing from the joint analysis of two GWA studies in the NHS and the WHS, covering most strongly associated SNPs and approximately 50kb upstream and 50kb downstream. The lower panels show estimates of the square of the correlation coefficient (r2) calculated for each pairwise comparison of SNPs. The r2 values are color coded according to the scale at the bottom. The middle panels show gene name, their direction of transcription and corresponding genome position.

Comment in

References

    1. Kvale G. Reproductive factors in breast cancer epidemiology. Acta Oncol. 1992;31:187–94. - PubMed
    1. Kaaks R, Lukanova A, Kurzer MS. Obesity, endogenous hormones, and endometrial cancer risk: a synthetic review. Cancer Epidemiol Biomarkers Prev. 2002;11:1531–43. - PubMed
    1. Paganini-Hill A, et al. Menstrual and reproductive factors and fracture risk: the Leisure World Cohort Study. J Womens Health (Larchmt) 2005;14:808–19. - PubMed
    1. Cui R, et al. Relationships of age at menarche and menopause, and reproductive year with mortality from cardiovascular disease in Japanese postmenopausal women: the JACC study. J Epidemiol. 2006;16:177–84. - PMC - PubMed
    1. te Velde ER, Pearson PL. The variability of female reproductive ageing. Hum Reprod Update. 2002;8:141–54. - PubMed

Publication types

MeSH terms