. 2009 Jul 9;28(27):2513-23.
doi: 10.1038/onc.2009.116. Epub 2009 May 18.

Ror2, a developmentally regulated kinase, promotes tumor growth potential in renal cell carcinoma

Affiliations

Ror2, a developmentally regulated kinase, promotes tumor growth potential in renal cell carcinoma

T M Wright et al. Oncogene. .

Abstract

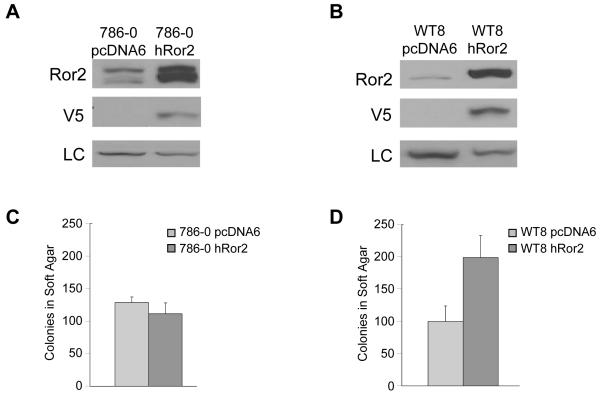
Inappropriate kinase expression and subsequent promiscuous activity defines the transformation of many solid tumors including renal cell carcinoma (RCC). Thus, the expression of novel tumor-associated kinases has the potential to dramatically shape tumor cell behavior. Further, identifying tumor-associated kinases can lend insight into patterns of tumor growth and characteristics. Here, we report the identification of the RTK-like orphan receptor 2 (Ror2), a new tumor-associated kinase in RCC cell lines and primary tumors. Ror2 is an orphan receptor tyrosine kinase with physiological expression normally seen in the embryonic kidney. However, in RCC, Ror2 expression correlated with expression of genes involved at the extracellular matrix, including Twist and matrix metalloprotease-2 (MMP2). Expression of MMP2 in RCC cells was suppressed by Ror2 knockdown, placing Ror2 as a mediator of MMP2 regulation in RCC and a potential regulator of extracellular matrix remodeling. The suppression of Ror2 not only inhibited cell migration, but also inhibited anchorage-independent growth in soft agar and growth in an orthotopic xenograft model. These findings suggest a novel pathway of tumor-promoting activity by Ror2 within a subset of renal carcinomas, with significant implications for unraveling the tumorigenesis of RCC.


Figures

Figure 1
Figure 1. Human RCC tumors express Ror2
A. Human Phospho-RTK array screen for activated kinases in RCC. Utilizing a phospho-RTK array, 42 RTKs were screened for phosphorylation in RCC using the 786-0 RC3 cell line. Activated kinases were identified using an HRP-conjugated pan-phosphotyrosine antibody. From this screen, one novel RTK identified was Receptor Tyrosine Kinase-like Orphan Receptor 2 (Ror2). Additional spots demonstrating positive identification include a kinase known to be activated in RCC cells (EGFR) and negative control spots (Goat IgG). B. RT-PCR of archival human tumor samples shows mRNA expression of Ror2. Nineteen (19) archival tumor samples from the UNC Tumor Bank (1994-2004) were amplified with primers against the CRD domain of Ror2 (HPRT gene used as a control to assess quality of RNA). Direct sequencing of the PCR product confirmed the product as Ror2. Representative examples of Ror2 expression seen in RCC tumors are shown. A tabular distribution of tumors expressing a Ror2 transcript is shown for the individual RCC histological subtypes. C. Ror2 is expressed in fetal kidney tissues. Left panel, H&E stain of fetal kidney, Middle panel, Ror2 expression detected by immunohistochemistry on primitive migrating mesenchymal cells, Right panel, CD117 is used as a negative control for staining specificity in the fetal kidney and (expected to be negative as shown) is a control for staining specificity for the secondary antibody.
Figure 2
Figure 2. Immunofluorescence detects Ror2 in human RCC tumors
Three individual RCC tumors were stained to determine the cellular expression of Ror2. H&E of the 3 tumors verifies clear cell histology. Two tumors were selected having high expression of Ror2 transcript (+), and a third tumor identified as having undetectable levels of Ror2 transcript (-) was used to verify antibody specificity. An Ror2 antibody was used to assay for Ror2 expression in the RCC tumors. Top and middle panels show that Ror2, a transmembrane cell surface receptor, is mainly expressed in the cell surface or cytoplasm, with no detectable protein in the control tumor in the bottom panel. Control panels show negative staining in the no primary control. DAPI is included for both primary and no primary antibody stained sections to demonstrate nuclear staining. All pictures were taken at 20X and the black bar represents 34 uM.
Figure 3
Figure 3. Microarray analysis of RCC tumors defines a tumor genetic phenotype
Tumor mRNA from 40 RCC tumors were analyzed by Agilent 4×44K gene expression microarray and separated into groups based on their Ror2 expression. SAM analysis was performed to identify differentially expressed genes, and the most significant in (A) all histologies (FDR <0.045) and (B) clear cell only histology (FDR<0.0388) were analyzed by two-way clustering. C. Ror2 (+) RCC tumors have increased mRNA expression of genes involved at the ECM. Quantitative RT-PCR analysis of 2 Ror2 (-) and 2 Ror2 (+) human RCC tumors were analyzed to verify microarray expression. Transcript values are normalized to β-actin RNA internal standard and are shown relative to an Ror2 (-) tumor (Tumor A). Error bars represent SEM. Significant differences were observed in Twist1 (*p<0.001) and MMP2 (**p<0.0001) in the Ror2 (+) tumors (*p<0.001) compared to Ror2 (-) tumor (Tumor A), p-values are based on cT values. D. Table showing the significant gene set list with corresponding genes involved at the ECM that clustered with Ror2 expression. Tumor mRNA were analyzed by multiclass comparison using SAM, and the resulting Ror2 cluster was further analyzed for over-represented gene categories using the Expression Analysis Systematic Explorer (EASE) (Hosack et al., 2003). Genes from the three most tightly associated ontogenies are listed in the table.
Figure 4
Figure 4. Ror2 expression directs MMP2 expression, anchorage independent growth and invasive potential in vitro
A. Ror2 expression is suppressed in 786-0 cells by shRNA. Whole cell protein extracts from RCC cells (786-0) were infected with a scramble short hairpin retrovirus, a pRS control virus or Ror2 short hairpin retroviruses and immunoblotted with polyclonal Ror2 antibody, Twist1 antibody or Ku80 antibody as a loading control (LC). B. MMP2 expression is suppressed when Ror2 levels are knocked down. Quantitative RT-PCR analysis of two 786-0 Ror2 knockdown cell lines demonstrates MMP2 suppression coordinate with the degree of suppression of Ror2. Significant differences were observed in MMP2 (**p<0.001 for both comparisons) in the 786-0 Ror2 suppressed cell lines compared to the Ror2 expressing cell lines (**p<0.001 for both comparisons). Transcript values are normalized to β-actin RNA internal standard and are shown relative to 786-0 scramble RNA. Error bars represent SEM. C. Ror2 knockdown decreases cell migration. RCC cells (786-0) infected with a control virus pRS or Ror2 short hairpin RNA retroviruses were plated and allowed to grow overnight. Cells were scratched and the length of the scratch was observed for both 0 hr and 16hr timepoints (left). Significant differences were observed when comparing the % invasion of the Ror2 knockdown cell lines compared to the empty vector pRS control (right) - (**p<0.0001, *p=0.009). Error bars represent SEM. D. Ror2 knockdown inhibits anchorage independent growth. RCC cells (786-0) infected with a scramble short hairpin RNA retrovirus, a control virus pRS or Ror2 short hairpin RNA retroviruses were allowed to grow in soft agar over a period of 3-4 weeks. Ror2 knockdown cells have inhibited growth in comparison to the scramble short hairpin retrovirus and the empty vector pRS control. Multicellular colonies >150 uM were counted from triplicate plates. Data shown is from the combination of two representative experiments (**p<0.0001). Error bars represent SEM. Inset - Cells were stained with MTT dye, and pictures taken at 10x magnification. Black bar represents 67.3 um.
Figure 5
Figure 5. Ror2 overexpression enhances anchorage independent growth in vitro
A. Ror2 expression is increased in 786-0 cells with an overexpression plasmid. RCC cells (786-0) were transfected with control plasmid pcDNA6 or hRor2 cDNA and immunoblotted with polyclonal Ror2 antibody, a V5 antibody or Ku80 antibody as a loading control (LC). B. Ror2 expression is amplified in the 786-0 derivative cell line WT8, a clone expressing a VHL cDNA which expresses reduced levels of Ror2. The RCC cell line WT8 was transfected with a control plasmid pcDNA6 or hRor2 cDNA and immunoblotted with polyclonal Ror2 antibody, a V5 antibody or Ku80 antibody as a loading control (LC). Panel A and B represent a contiguous blot with intervening lanes removed. C. An increase in Ror2 expression in Ror2 expressing cells does not affect anchorage independent growth. RCC cells with high levels of Ror2 already expressed (786-0) transfected with a control plasmid pcDNA6 or hRor2 cDNA were allowed to grow in soft agar over a period of 3-4 weeks. Multicellular colonies >150 uM were counted from triplicate plates. An increase in Ror2 expression did not change colony growth. Data shown is from two representative experiments. D. Ror2 overexpression increases anchorage independent growth in cells lacking Ror2 expression. RCC cells lacking high level of expression of Ror2 (WT8) transfected with a control plasmid pcDNA6 or hRor2 cDNA were allowed to grow in soft agar over a period of 3-4 weeks. Multicellular colonies >150 uM were counted from triplicate plates. Ror2 overexpression cells displayed enhanced growth in comparison to the control empty vector pcDNA6. Data shown is from one representative experiment (p=0.079).
Figure 6
Figure 6. Ror2 suppression reduces tumor growth in vivo
Two independent shRNA cell lines were injected orthotopically under the kidney capsule of athymic nude mice, compared to 786-0 pRS control cells. A. Histology of control engrafted tumor with adjacent normal kidney tissue is shown. B. H&E of the kidney surface demonstrated that Ror2-suppressed engrafted tumor cells were present in the vicinity of the subcapsule microscopically but failed to form distinct tumors. C. Macroscopically visible tumors were only detected in mice injected with 786-0 pRS control cells. Macroscopic and microscopic evidence of tumor cells was tabulated, demonstrating significantly more tumors identified in the control cell implanted mice than those implanted with either of the two Ror2 shRNA cell lines. D. Average tumor diameter of each implant from the 786-0 pRS control cell line and the two Ror2 shRNA cell lines (in cm). E. The control engrafted tumor, 786-0 pRS, displays increased levels of MMP2 as determined by immunohistochemistry. F. Control panel for 786-0 pRS shows negative staining in the no primary control. G. The Ror2-suppressed engrafted tumor, 786-0 shRor2.1, has diminished levels of MMP2 expression compared to the empty vector control, 786-0 pRS. H. Control panel for 786-0 shRor2.1 shows insignificant background staining in the no primary control.

Similar articles

Cited by

References

    1. Atkins MB, Hidalgo M, Stadler WM, Logan TF, Dutcher JP, Hudes GR, et al. Randomized phase II study of multiple dose levels of CCI-779, a novel mammalian target of rapamycin kinase inhibitor, in patients with advanced refractory renal cell carcinoma. J Clin Oncol. 2004;22:909–18. - PubMed
    1. Billiard J, Way DS, Seestaller-Wehr LM, Moran RA, Mangine A, Bodine PV. The orphan receptor tyrosine kinase Ror2 modulates canonical Wnt signaling in osteoblastic cells. Mol Endocrinol. 2005;19:90–101. - PubMed
    1. Cancer Facts and Figures. American Cancer Society, Inc; Atlanta, GA: 2008.
    1. Coombs GS, Covey TM, Virshup DM. Wnt signaling in development, disease and translational medicine. Curr Drug Targets. 2008;9:513–31. - PubMed
    1. Cowey CL, Rathmell WK. Using molecular biology to develop drugs for renal cell carcinoma. Expert Opinion on Drug Discovery. 2008;3:311–327. - PMC - PubMed

Publication types

MeSH terms

Substances