Photoacoustic endoscopy
- PMID: 19448831
- PMCID: PMC2738934
- DOI: 10.1364/ol.34.001591
Photoacoustic endoscopy
Abstract
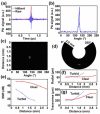
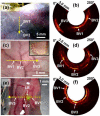
We have developed photoacoustic endoscopy with a miniaturized imaging probe. A light-guiding optical fiber, an ultrasonic sensor, and a mechanical scanning unit are integrated to enable circumferential sector scanning, which produces B-scan images. Biological tissues, including the gastrointestinal tract of a rat, have been imaged ex vivo or in situ.
Figures


References
-
- Wang LV, editor. Photoacoustic Imaging and Spectroscopy. Taylor & Francis/CRC Press; 2009.
-
- Oraevsky AA, Karabutov AA. Optoacoustic tomography. In: Vo-Dinh T, editor. Biomedical Photonics Handbook. Chap 34. vol. PM125. CRC Press; 2003.
-
- Maslov K, Stoica G, Wang LV. In vivo dark-field reflection-mode photoacoustic microscopy. Opt. Lett. 2005;30:625–627. - PubMed
-
- Zhang HF, Maslov K, Stoica G, Wang LV. Functional photoacoustic microscopy for high-resolution and noninvasive in vivo imaging. Nat. Biotechnol. 2006;24:848–851. - PubMed
-
- Tearney GJ, Boppart SA, Bouma BE, Brezinski ME, Weissman NJ, Southern JF, Fujimoto JG. Scanning single-mode fiber optic catheter-endoscope for optical coherence tomography. Opt. Lett. 1996;21:543–545. - PubMed
Publication types
MeSH terms
Substances
Grants and funding
LinkOut - more resources
Full Text Sources
Other Literature Sources
Medical

