. 2009 Apr;13(4):664-79.
doi: 10.1111/j.1582-4934.2008.00546.x.

Intracardiac injection of erythropoietin induces stem cell recruitment and improves cardiac functions in a rat myocardial infarction model

Affiliations

Intracardiac injection of erythropoietin induces stem cell recruitment and improves cardiac functions in a rat myocardial infarction model

Christian Klopsch et al. J Cell Mol Med. 2009 Apr.

Abstract

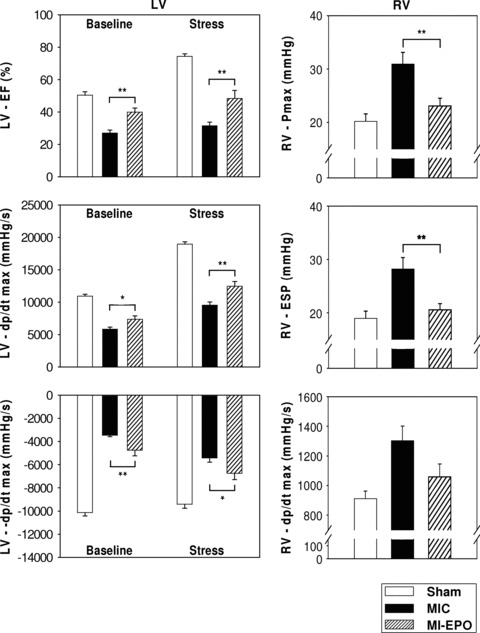
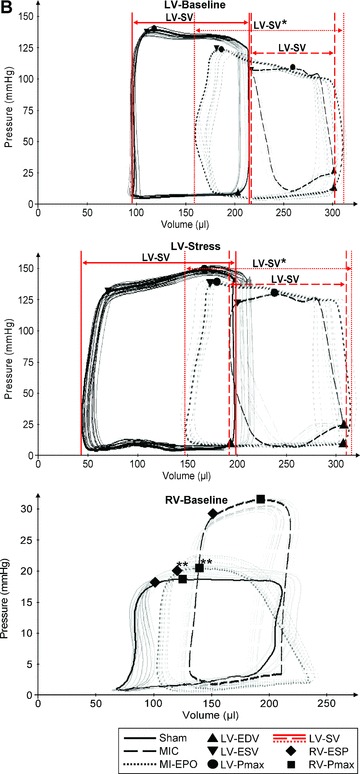
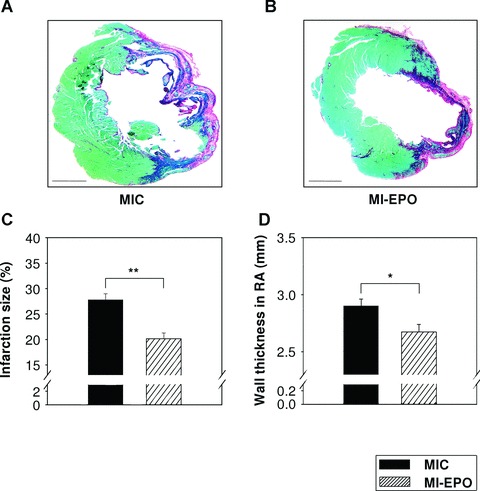
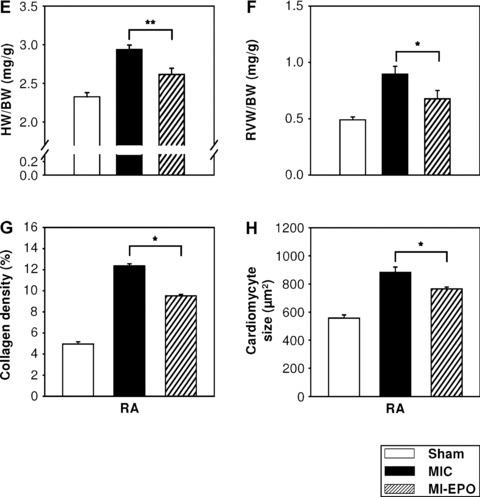
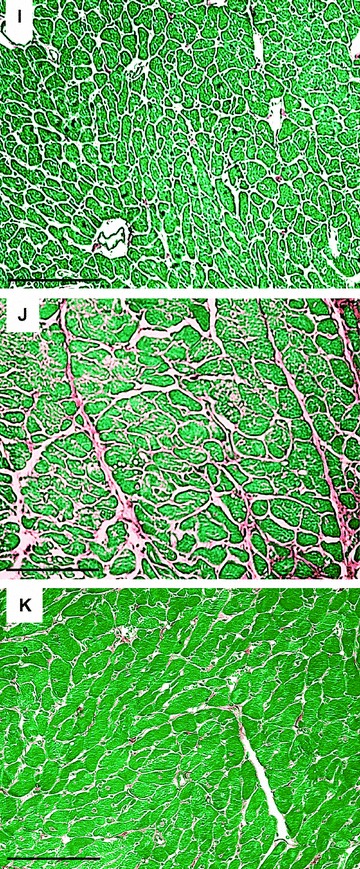
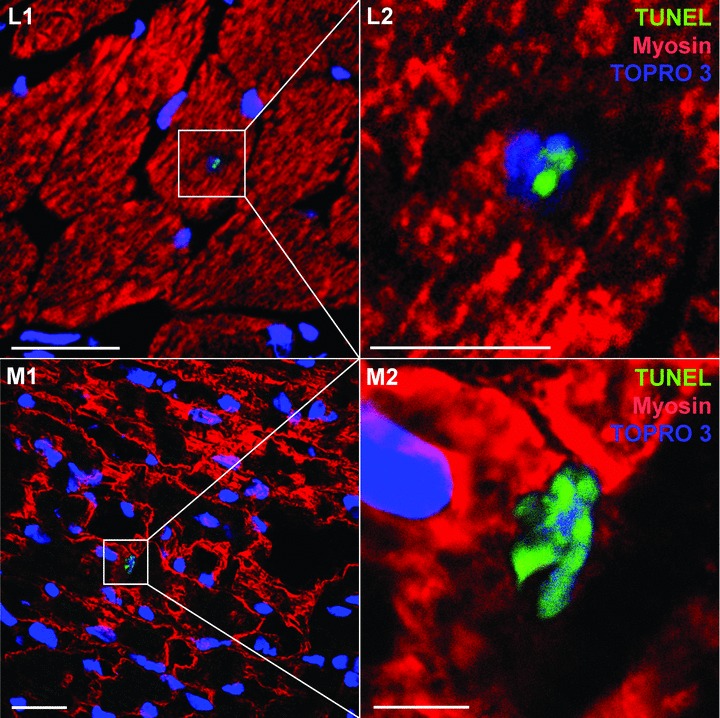
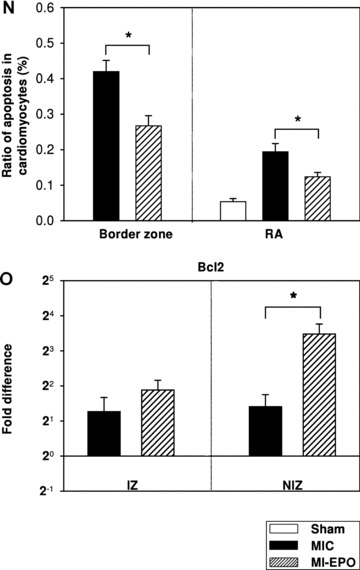
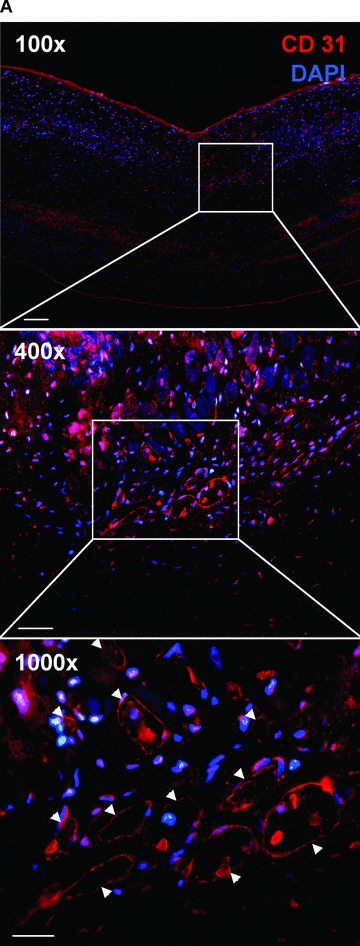
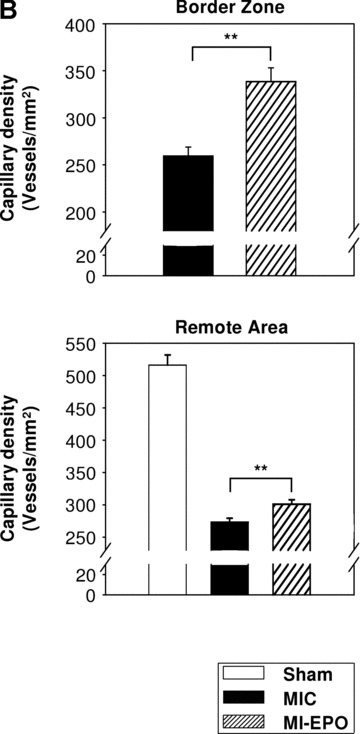
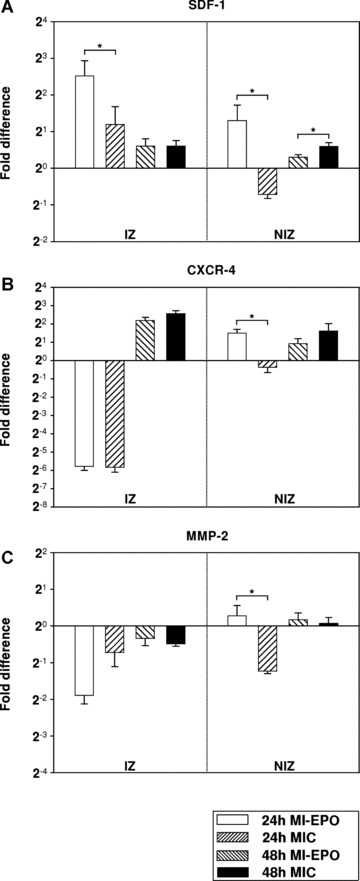
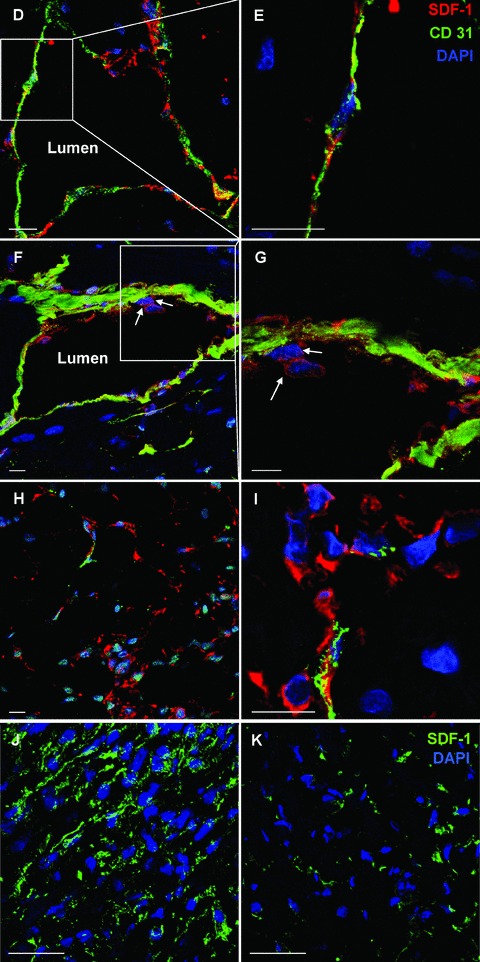
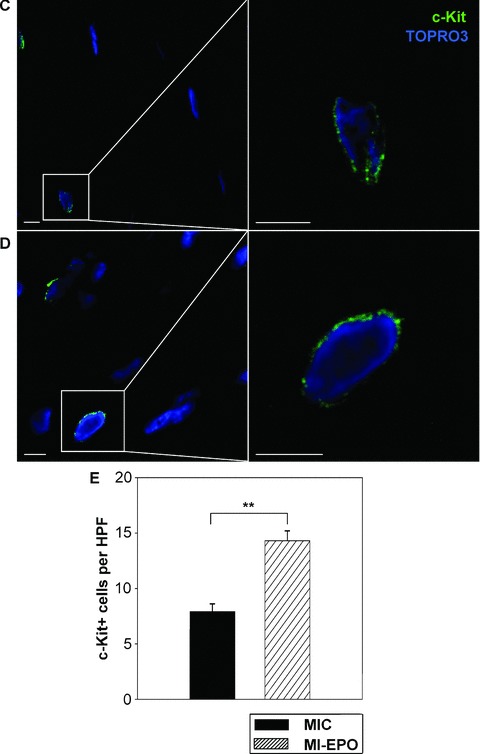
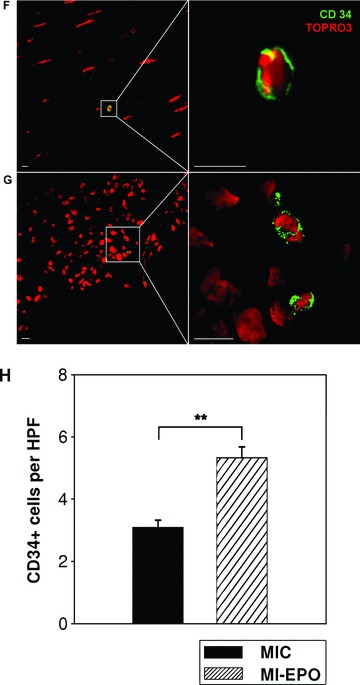
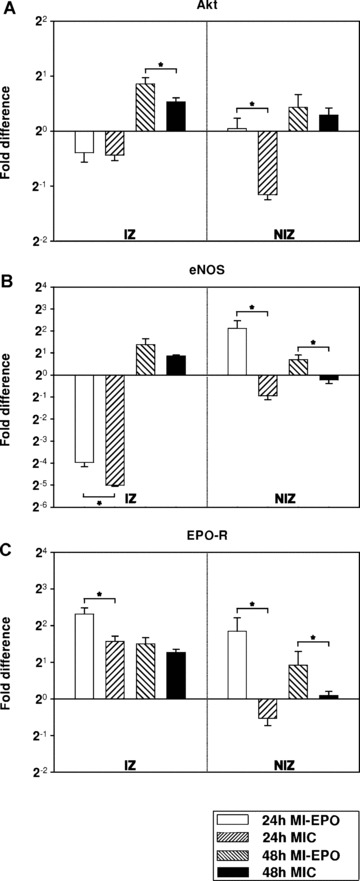
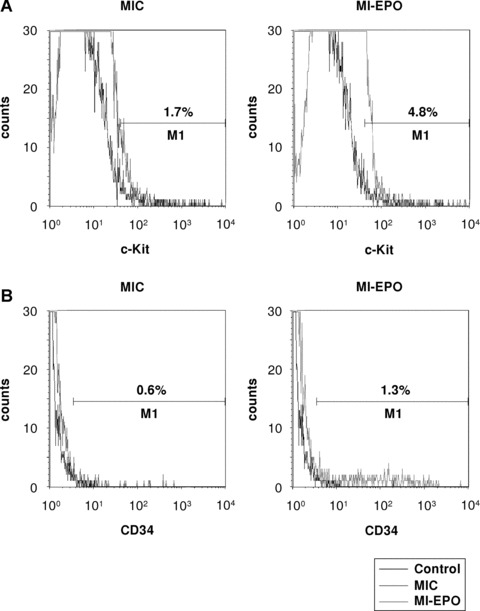
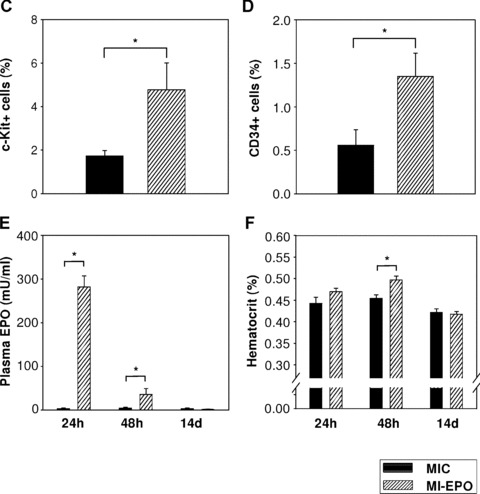
Erythropoietin (EPO) protects the myocardium from ischaemic injury and promotes beneficial remodelling. We assessed the therapeutic efficacy of intracardiac EPO injection and EPO-mediated stem cell homing in a rat myocardial infarction (MI) model. Following MI, EPO (3000 U/kg) or saline was delivered by intracardiac injection. Compared to myocardial infarction control group (MIC), EPO significantly improved left ventricular function (n =11-14, P < 0.05) and decreased right ventricular wall stress (n = 8, P < 0.05) assessed by pressure-volume loops after 6 weeks. MI-EPO hearts exhibited smaller infarction size (20.1 +/- 1.1% versus 27.8 +/- 1.2%; n = 6-8, P < 0.001) and greater capillary density (338.5 +/- 14.7 versus 259.8 +/- 9.2 vessels per mm2; n = 6-8, P < 0.001) than MIC hearts. Direct EPO injection reduced post-MI myocardial apoptosis by approximately 41% (0.27 +/- 0.03% versus 0.42 +/- 0.03%; n = 6, P= 0.005). The chemoattractant SDF-1 was up-regulated significantly assessed by quantitative realtime PCR and immunohistology. c-Kit(+) and CD34(+) stem cells were significantly more numerous in MI-EPO than in MIC at 24 hrs in peripheral blood (n = 7, P < 0.05) and 48 hrs in the infarcted hearts (n = 6, P < 0.001). Further, the mRNAs of Akt, eNOS and EPO receptor were significantly enhanced in MI-EPO hearts (n = 7, P < 0.05). Intracardiac EPO injection restores myocardial functions following MI, which may attribute to the improved early recruitment of c-Kit(+) and CD34(+) stem cells via the enhanced expression of chemoattractant SDF-1.


Figures

1
1
Direct EPO injection restored cardiac functions 6 weeks after MI assessed by catheterization. (A) Left ventricular function (Sham n= 11, MIC n= 14, MI-EPO n= 11) at both baseline and stress conditions (left panel) as well as right ventricular function (Sham n= 5, MIC n= 8, MI-EPO n= 8) at baseline condition (right panel). (B) Representative single heart beat obtained from Sham (solid loops), MIC (dashed loops) and MI-EPO (dotted loops) hearts revealed the increments of left ventricular stroke volume (LV-SV) in MI-EPO compared with MIC under baseline (upper panel) and dobutamine stress (middle panel) conditions. RV examinations (lower panel) displayed the reductions of right ventricular maximum pressure (RV-Pmax) and end-systolic pressure (RV-ESP) in MI-EPO compared with MIC under baseline conditions. *P< 0.05 MIC versus MI-EPO, **P< 0.01 MIC versus MI-EPO.
1
1
Direct EPO injection restored cardiac functions 6 weeks after MI assessed by catheterization. (A) Left ventricular function (Sham n= 11, MIC n= 14, MI-EPO n= 11) at both baseline and stress conditions (left panel) as well as right ventricular function (Sham n= 5, MIC n= 8, MI-EPO n= 8) at baseline condition (right panel). (B) Representative single heart beat obtained from Sham (solid loops), MIC (dashed loops) and MI-EPO (dotted loops) hearts revealed the increments of left ventricular stroke volume (LV-SV) in MI-EPO compared with MIC under baseline (upper panel) and dobutamine stress (middle panel) conditions. RV examinations (lower panel) displayed the reductions of right ventricular maximum pressure (RV-Pmax) and end-systolic pressure (RV-ESP) in MI-EPO compared with MIC under baseline conditions. *P< 0.05 MIC versus MI-EPO, **P< 0.01 MIC versus MI-EPO.
2
2
Effects of direct EPO injection on cardiac remodelling 6 weeks after MI. (A, B) Representative left ventricular cross-sections stained with Sirius Red (red, fibrosis) and Fast Green FCF (green, myocytes) from rats without (left) and with (right) EPO treatment. (C) Ratio of infarction area to entire LV is decreased in MI-EPO (n= 6) compared with MIC (n= 8). (D) Wall thickness of RA is significantly reduced in MI-EPO (n= 6) compared with MIC (n= 8). (E, F) EPO treatment results in a significantly decreased HW/BW ratio, and RVW/BW ratio (Sham n= 11, MIC n= 14, MI-EPO n= 11). (G, H) Collagen density (G) and cardiomyocyte size (H) in RA of MI-EPO hearts (n= 6) were reduced compared with MIC (n= 6). (I-K) Representative staining for Sirius Red (red, fibrosis) and Fast Green FCF (green, myocytes) in the RA of Sham (I, upper panel), MIC (J, middle panel) and MI-EPO (K, lower panel). Scale bars = 150 μm. (L, M) Representative immunostaining for TUNEL (green, square) and cardiac myosin (red) in RA (L, upper panel) and the border zone (M, lower panel) of MIC hearts. Scale bars = 25 μm (left panel). Scale bars = 5 μm (right panel). Blue, TOPRO3 in nuclei. (N) Cardiomyocyte apoptosis was reduced in both the border zone (left) and the RA (right) in MI-EPO (n= 6) compared with MIC (n= 6). (0) Quantitative real-time PCR analysis for Bcl2 gene in the IZ (left) and NIZ (right) of MI-EPO (n= 6), MIC (n= 6) and Sham (n= 6) hearts. The average mRNA expression level in the sham hearts was arbitrarily given a value of 1 (2°). *P< 0.05, **P< 0.01.
2
2
Effects of direct EPO injection on cardiac remodelling 6 weeks after MI. (A, B) Representative left ventricular cross-sections stained with Sirius Red (red, fibrosis) and Fast Green FCF (green, myocytes) from rats without (left) and with (right) EPO treatment. (C) Ratio of infarction area to entire LV is decreased in MI-EPO (n= 6) compared with MIC (n= 8). (D) Wall thickness of RA is significantly reduced in MI-EPO (n= 6) compared with MIC (n= 8). (E, F) EPO treatment results in a significantly decreased HW/BW ratio, and RVW/BW ratio (Sham n= 11, MIC n= 14, MI-EPO n= 11). (G, H) Collagen density (G) and cardiomyocyte size (H) in RA of MI-EPO hearts (n= 6) were reduced compared with MIC (n= 6). (I-K) Representative staining for Sirius Red (red, fibrosis) and Fast Green FCF (green, myocytes) in the RA of Sham (I, upper panel), MIC (J, middle panel) and MI-EPO (K, lower panel). Scale bars = 150 μm. (L, M) Representative immunostaining for TUNEL (green, square) and cardiac myosin (red) in RA (L, upper panel) and the border zone (M, lower panel) of MIC hearts. Scale bars = 25 μm (left panel). Scale bars = 5 μm (right panel). Blue, TOPRO3 in nuclei. (N) Cardiomyocyte apoptosis was reduced in both the border zone (left) and the RA (right) in MI-EPO (n= 6) compared with MIC (n= 6). (0) Quantitative real-time PCR analysis for Bcl2 gene in the IZ (left) and NIZ (right) of MI-EPO (n= 6), MIC (n= 6) and Sham (n= 6) hearts. The average mRNA expression level in the sham hearts was arbitrarily given a value of 1 (2°). *P< 0.05, **P< 0.01.
3
3
Direct EPO injection induces neovascularization 6 weeks after MI. (A) Endothelial CD31 staining in the infarction area of the LV wall revealed a complex vascular architecture that consisted of regularly shaped vessels (arrows) in MI-EPO, which were not present in MIC. Blue, DAPI in nuclei; 100×, Bar = 100 μm; 400×, Bar = 50 μm; 1000×, Bar = 25 μm. (B) Capillary density was significantly higher in MI-EPO (n= 6) compared with MIC (n= 8) in both the RA and the border zone of the LV. *P< 0.05, **P< 0.01.
3
3
Direct EPO injection induces neovascularization 6 weeks after MI. (A) Endothelial CD31 staining in the infarction area of the LV wall revealed a complex vascular architecture that consisted of regularly shaped vessels (arrows) in MI-EPO, which were not present in MIC. Blue, DAPI in nuclei; 100×, Bar = 100 μm; 400×, Bar = 50 μm; 1000×, Bar = 25 μm. (B) Capillary density was significantly higher in MI-EPO (n= 6) compared with MIC (n= 8) in both the RA and the border zone of the LV. *P< 0.05, **P< 0.01.
4
4
Direct EPO injection up-regulates SDF-1, CXCR4 and MMP2. (AC) Quantitative real-time PCR analysis for SDF-1 (A), CXCR4 (B) and MMP2 (C) genes, respectively, in IZ and NIZ of MI-EPO (n= 7), MIC (n= 7) and Sham (n= 7) hearts. The average mRNA expression level in the sham hearts was arbitrarily given a value of 1 (2°). *P< 0.05. (D–l) Representative confocal microscopic images illustrating different expression patterns of SDF-1 in MI-EPO. (D-G) In NIZ of MI-EPO, most SDF-1+ cells (red) co-localized with CD31 (green). Occasionally, cell adhesion (arrows in F and G) with the SDF-1+ endothelial cells was visible. (H, I) In contrast, a number of SDF-1+ cells (red) in IZ of MI-EPO hearts did not co-localize with CD31 (green). Scale bars = 10 μm. Blue, DAPI in nuclei. (J, K) Confocal microscopic images reveal more abundant SDF-1+ signals (green) in IZ of MI-EPO (n= 6) than MIC (n= 6) hearts after EPO injection. Scale bars = 30 μm. Blue, DAPI in nuclei.
4
4
Direct EPO injection up-regulates SDF-1, CXCR4 and MMP2. (AC) Quantitative real-time PCR analysis for SDF-1 (A), CXCR4 (B) and MMP2 (C) genes, respectively, in IZ and NIZ of MI-EPO (n= 7), MIC (n= 7) and Sham (n= 7) hearts. The average mRNA expression level in the sham hearts was arbitrarily given a value of 1 (2°). *P< 0.05. (D–l) Representative confocal microscopic images illustrating different expression patterns of SDF-1 in MI-EPO. (D-G) In NIZ of MI-EPO, most SDF-1+ cells (red) co-localized with CD31 (green). Occasionally, cell adhesion (arrows in F and G) with the SDF-1+ endothelial cells was visible. (H, I) In contrast, a number of SDF-1+ cells (red) in IZ of MI-EPO hearts did not co-localize with CD31 (green). Scale bars = 10 μm. Blue, DAPI in nuclei. (J, K) Confocal microscopic images reveal more abundant SDF-1+ signals (green) in IZ of MI-EPO (n= 6) than MIC (n= 6) hearts after EPO injection. Scale bars = 30 μm. Blue, DAPI in nuclei.
5
5
Direct EPO injection increases c-Kit+ and CD34+ signals. (A, B) Quantitative real-time PCR analysis for c-Kit (A) and CD34 (B) genes in IZ and NIZ of MI-EPO (n= 7), MIC (n= 7) and Sham (n= 7) hearts. The average mRNA expression level of c-Kit and CD34 in the sham hearts was arbitrarily given a value of 1 (2°). *P< 0.05. (C, D) Representative immunostaining for c-Kit in an EPO-treated heart. c-Kit+ cells (square) were identified in NIZ (C) and IZ (D) at 48 hrs after treatment. Bar = 5 μm. Blue, TOPRO3 in nuclei. (E) The number of c-Kit+ cells per high power field (HPF) in IZ of MI-EPO (n= 6) hearts was significantly higher than in MIC (n= 6) hearts. **P< 0.01. (F, G) Representative images for CD34+ (green) cells (square) in NIZ (F, Bar = 5 μm) and IZ (G, Bar = 10 μm) at 48 hrs after EPO treatment. Red, TOPRO3 in nuclei. (H) The number of CD34+ cells per HPF in IZ of MI-EPO (n= 6) was significantly higher than in MIC (n= 6) hearts. **P< 0.01.
5
5
Direct EPO injection increases c-Kit+ and CD34+ signals. (A, B) Quantitative real-time PCR analysis for c-Kit (A) and CD34 (B) genes in IZ and NIZ of MI-EPO (n= 7), MIC (n= 7) and Sham (n= 7) hearts. The average mRNA expression level of c-Kit and CD34 in the sham hearts was arbitrarily given a value of 1 (2°). *P< 0.05. (C, D) Representative immunostaining for c-Kit in an EPO-treated heart. c-Kit+ cells (square) were identified in NIZ (C) and IZ (D) at 48 hrs after treatment. Bar = 5 μm. Blue, TOPRO3 in nuclei. (E) The number of c-Kit+ cells per high power field (HPF) in IZ of MI-EPO (n= 6) hearts was significantly higher than in MIC (n= 6) hearts. **P< 0.01. (F, G) Representative images for CD34+ (green) cells (square) in NIZ (F, Bar = 5 μm) and IZ (G, Bar = 10 μm) at 48 hrs after EPO treatment. Red, TOPRO3 in nuclei. (H) The number of CD34+ cells per HPF in IZ of MI-EPO (n= 6) was significantly higher than in MIC (n= 6) hearts. **P< 0.01.
6
6
EPO up-regulates mRNA of Akt, eNOS and EPO-R. (A-C) Quantitative real-time PCR analysis of Akt (A), eNOS (B) and EPO-R (C) in IZ and NIZ of MI-EPO (n= 7), MIC (n= 7) and Sham (n= 7) hearts. The average mRNA expression level of Akt, eNOS and EPO-R in the Sham hearts was arbitrarily given a value of 1 (2°). *P< 0.05.
7
7
Effects of local EPO delivery on peripheral blood. (A–B) Direct administration of EPO mobilizes c-Kit+ and CD34+ cells to the peripheral blood at 24 hrs. Representative FACS plots of c-Kit+ (upper panel) and CD34+ (lower panel) populations within peripheral blood in MIC and MI-EPO. (C, D) Percentage of c-Kit+ (left) and CD34+ (right) cells within the nucleated cell fraction of peripheral blood in MIC (n= 7) and MI-EPO (n= 7). (E, F) Kinetics of plasma EPO level (E) and haematocrit (F) at 24 hrs, 48 hrs and 2 weeks (MIC n= 7,7,5; MI-EPO n= 7,7,5). *P< 0.05.
7
7
Effects of local EPO delivery on peripheral blood. (A–B) Direct administration of EPO mobilizes c-Kit+ and CD34+ cells to the peripheral blood at 24 hrs. Representative FACS plots of c-Kit+ (upper panel) and CD34+ (lower panel) populations within peripheral blood in MIC and MI-EPO. (C, D) Percentage of c-Kit+ (left) and CD34+ (right) cells within the nucleated cell fraction of peripheral blood in MIC (n= 7) and MI-EPO (n= 7). (E, F) Kinetics of plasma EPO level (E) and haematocrit (F) at 24 hrs, 48 hrs and 2 weeks (MIC n= 7,7,5; MI-EPO n= 7,7,5). *P< 0.05.

Similar articles

Cited by

References

    1. Jelkmann W, Wagner K. Beneficial and ominous aspects of the pleiotropic action of erythropoietin. Ann Hematol. 2004;83:673–86. - PubMed
    1. Zwezdaryk KJ, Coffelt SB, Figueroa YG, Liu J, Phinney DG, LaMarca HL, Florez L, Morris CB, Hoyle GW, Scandurro AB. Erythropoietin, a hypoxia-regulated factor, elicits a pro-angiogenic program in human mesenchymal stem cells. Exp Hematol. 2007;35:640–52. - PubMed
    1. Calvillo L, Latini R, Kajstura J, Leri A, Anversa P, Ghezzi P, Salio M, Cerami A, Brines M. Recombinant human erythro-poietin protects the myocardium from ischemia-reperfusion injury and promotes beneficial remodeling. Proc Natl Acad Sci USA. 2003;100:4802–6. - PMC - PubMed
    1. Parsa CJ, Matsumoto A, Kim J, Riel RU, Pascal LS, Walton GB, Thompson RB, Petrofski JA, Annex BH, Stamler JS, Koch WJ. A novel protective effect of ery-thropoietin in the infarcted heart. J Clin Invest. 2003;112:999–1007. - PMC - PubMed
    1. Tramontano AF, Muniyappa R, Black AD, Blendea MC, Cohen I, Deng L, Sowers JR, Cutaia MV, El-Sherif N. Erythropoietin protects cardiac myocytes from hypoxia-induced apoptosis through an Akt-depend-ent pathway. Biochem Biophys Res Commun. 2003;308:990–4. - PubMed

Publication types

MeSH terms