. 2009 Jun;22(6):1060-8.
doi: 10.1021/tx900027w.

Enzymatic methylation of DNA in cultured human cells studied by stable isotope incorporation and mass spectrometry

Affiliations

Enzymatic methylation of DNA in cultured human cells studied by stable isotope incorporation and mass spectrometry

Jason L Herring et al. Chem Res Toxicol. 2009 Jun.

Abstract

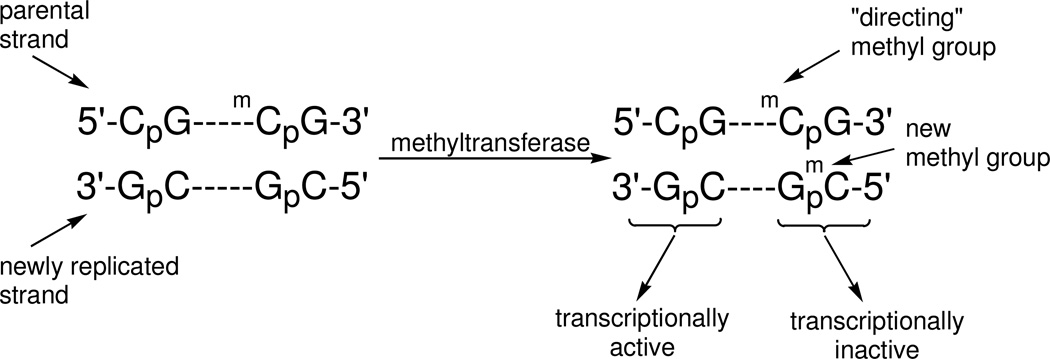
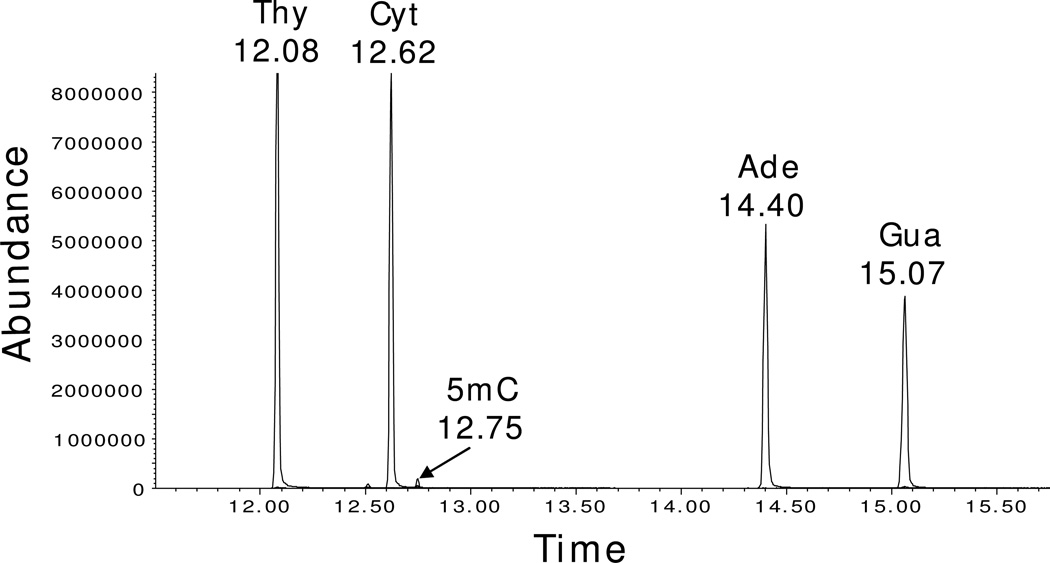
Enzymatic methylation of cytosine residues in DNA, in conjunction with covalent histone modifications, establishes an epigenetic code essential for the proper control of gene expression in higher organisms. Once established during cellular differentiation, the epigenetic code must be faithfully transmitted to progeny cells. However, epigenetic perturbations can be found in most if not all cancer cells, and the mechanisms leading to these changes are not well understood. In this paper, we describe a series of experiments aimed at understanding the dynamic process of DNA methylation that follows DNA replication. Cells in culture can be propagated in the presence of (15)N-enriched uridine, which labels the pyrimidine precursor pool as well as newly replicated DNA. Simultaneous culture in the presence of (2)H-enriched methionine results in labeling of newly methylated cytosine residues. An ensemble of 5-methylcytosine residues differing in the degree of isotopic enrichment is generated, which can be examined by mass spectrometry. Using this method, we demonstrate that the kinetics of both DNA replication and methylation of newly replicated DNA are indistinguishable. The majority of methylation following DNA replication is shown to occur on the newly synthesized DNA. The method reported here does, however, suggest an unexpected methylation of parental DNA during DNA replication, which might indicate a previously undescribed chromatin remodeling process. The method presented here will be useful in monitoring the dynamic process of DNA methylation and will allow a more detailed understanding of the mechanisms of clinically used methylation inhibitors and environmental toxicants.


Figures

Figure 1
Figure 1. Methylation of cytosine in DNA
Newly replicated, hemimethylated DNA is acted on by a maintenance DNA methyltransferase for heritable transmission of the cytosine methylation pattern. The 5mC (mC) in the parental strand “directs” methylation to the opposing cytosine residue in the newly replicated strand.
Figure 2
Figure 2. Measuring 5mC in DNA using GC/MS
Chromatogram of DNA from K-562 cells processed for GC/MS analysis, showing separation of silylated Ade, Cyt, Gua, Thy, and 5mC. The mass spectrum of silylated 5mC produces a major fragment (M-57) at 296 m/z with a retention time of 12.75 min.
Figure 3
Figure 3. Dual label DNA enrichment scheme
When grown in the presence of 15N-enriched uridine, cells metabolize the isotopically enriched pyrimidine to dCTP+2 and dTTP+2 which are then incorporated into DNA. The 2H3-methionine is metabolized to SAM+3, the donor in the enzymatic methylation of cytosine residues in DNA. The relative amounts of enriched and unenriched bases in the DNA are a function of the degree of enrichment of the corresponding precursor pool and the period of time in the enriched media. An ensemble of potential isotopomers of cytosine, thymine and 5mC are generated as indicated.
Figure 4
Figure 4. Comparison of the experimental and theoretical ion cluster for the predominant ion of unenriched 5mC
The predominant ion observed for the TBDMS derivative of 5mC is the M-57 ion resulting from the loss of a tert-butyl group. The molecular formula of the 5mC ion is C13H26N3OSi2 with a monoisotopic mass of 296 amu. Mass spectral lines corresponding to heavier isotopomers of the 5mC M-57 ion of unenriched 5mC are observed due to the presence of heavier isotopes of C, H, N, O, and Si at natural abundance as indicated by the solid line. Upon the basis of the molecular formula and the known natural abundance of heavier isotopes, the contribution of heavier isotopomers can be calculated, and is indicated by the dashed line. The correlation coefficient (r2) between the expected and calculated relative abundance is 0.99.
Figure 5
Figure 5. Deconvolution of a mass spectrum resulting from an equimolar mixture of 5mC isotopomers
A series of 5mC isotopomers were chemically synthesized and characterized by standard methods. An equimolar mixture of four isotopomers was prepared, hydrolyzed, derivatized and analyzed by GC/MS. The resulting mass spectrum of the M-57 fragment is shown in panel (A). The mass spectral lines from 296 to 304 amu arise from the ensemble of isotopomers. The experimental mass spectrum was deconvoluted to reveal the relative amounts of each of the isotopomers in the mixture. The relative amounts determined from the analysis (panel A) are within 1% of the expected amount (25% for each), and were used to generate a theoretical mass spectrum. The values of the observed and theoretical relative peaks heights are plotted in panel (B), with the line through the points described by the equation y = 1.0012×, and the correlation coefficient, r2 = 0.9988.
Figure 6
Figure 6. Change in isotopomer levels for cytosine and thymine in cells cultured in 15N-enriched uridine
Cells (K-562) were cultured in the presence of both 100 µM 15N-enriched uridine and 100 µM 2H-enriched methionine for over five days. A fraction of the cells were harvested and DNA was extracted for GC/MS analysis at selected time intervals. Isotopically labeled 15N-enriched uridine was incorporated into DNA as cytosine+2 (C+2) and thymine+2 (T+2) and the relative incorporation of the heavier isotope increased with time. Experimental data were fitted to exponential growth equations, (Eqns found in Materials and Methods). An observed rate constant, kobs, for DNA replication was determined by analyzing both the C+2 and T+2 curves separately, and the values compare well, as is expected. Experimental data points are averages of 3 replicates. In all cases, the standard deviation is smaller than the size of the data points.
Figure 7
Figure 7. Change in isotopomer levels for 5mC in cells cultured in 15N-enriched uridine and 2H-enriched methionine. Newly replicated DNA
Cells (K-562) cultured in the presence of 15N-enriched uridine and 2H-enriched methionine (as mentioned in Fig. 6) were harvested and DNA analyzed as before. Cells were harvested and DNA was extracted for GC/MS analysis. In the presence of stable isotope enriched uridine (Urd+2), newly synthesized DNA will contain C+2 only in the newly synthesized strand. The newly incorporated cytosine residues in appropriate sequences can be methylated with either enriched methionine (methyl+3) or unenriched methionine (methyl+0), resulting in 5mC+5 or 5mC+2, respectively. The relative amounts of these isotopomers of 5mC were determined by deconvolution of the experimental 5mC mass spectrum and calculated as shown (solid lines – described by Eqns found in Materials and Methods). An observed rate constant, kobs, was determined for DNA replication by analyzing the 5mC curves, comparing well to that determined by C+2 and T+2 above, as expected. Experimental data points are averages of 3 replicates. In all cases, the standard deviation is smaller than the size of the data points.
Figure 8
Figure 8. Change in isotopomer levels for 5mC in cells cultured in 15N-enriched uridine and 2H-enriched methionine. Parental DNA
Cells (K-562) cultured in the presence of 15N-enriched uridine and 2H-enriched methionine (as mentioned in Fig. 6 and 7) were harvested and DNA analyzed as before. The parental DNA in the cultured cells prior to the addition of stable isotope precursors is unenriched. The relative amount of 5mC+0 at a given time can be predicted from the degree of enrichment of the precursor pool and the rate of DNA replication, both determined independently as shown in Fig. 6 and Fig. 7. The decline in 5mC+0 with time can be predicted from these parameters (solid line above). The experimentally determined initial rate of decline of 5mC+0 is greater than expected. Similarly, enriched methionine could serve as a substrate for the methylation of unenriched cytosine residues found predominantly in the parental DNA, and the increase in the percentage of 5mC+3 can also be predicted. The rate of increase of 5mC+3 is also greater than expected. The unexpected loss of 5mC+0 with time approximately equals the increase in 5mC+3, resulting in overall constant levels of 5mC in the DNA. The kobs displayed here was determined by analyzing the 5mC curves in Fig. 7. Experimental data points are averages of 3 replicates. In all cases, the standard deviation is smaller than the size of the data points.
Figure 9
Figure 9. DNA methylation coupled with chromatin remodeling during cell replication
The methylation of newly incorporated cytosine residues in hemimethylated DNA following DNA replication is shown on the right, and is referred to as maintenance methylation. A novel process referred to as chromatin remodeling is shown on the left, in which parental strand DNA could actively lose or gain a methyl group by an unknown mechanism. This model could potentially explain why unenriched 5mC+0 residues are lost at a faster rate than could be attributed to DNA replication alone, and why enriched 5mC+3 residues increase faster than can be accounted for by DNA replication alone.

Similar articles

Cited by

References

    1. Razin A, Riggs AD. DNA methylation and gene function. Science. 1980;210:604–610. - PubMed
    1. Jones PA, Taylor SM. Cellular differentiation, cytidine analogs and DNA methylation. Cell. 1980;20:85–93. - PubMed
    1. Cooper DN, Taggart MH, Bird AP. Unmethylated domains in vertebrate DNA. Nucleic Acids Res. 1983;11:647–658. - PMC - PubMed
    1. Singal R, Ginder GD. DNA methylation. Blood. 1999;93:4059–4070. - PubMed
    1. Ehrlich M, Wang RY-H. 5-Methylcytosine in eukaryotic DNA. Science. 1981;212:1350–1357. - PubMed

Publication types