Comparative Study
. 2009 Jun 30;48(25):6022-33.
doi: 10.1021/bi900517y.

Human AP endonuclease 1 stimulates multiple-turnover base excision by alkyladenine DNA glycosylase

Affiliations
Comparative Study

Human AP endonuclease 1 stimulates multiple-turnover base excision by alkyladenine DNA glycosylase

Michael R Baldwin et al. Biochemistry. .

Abstract

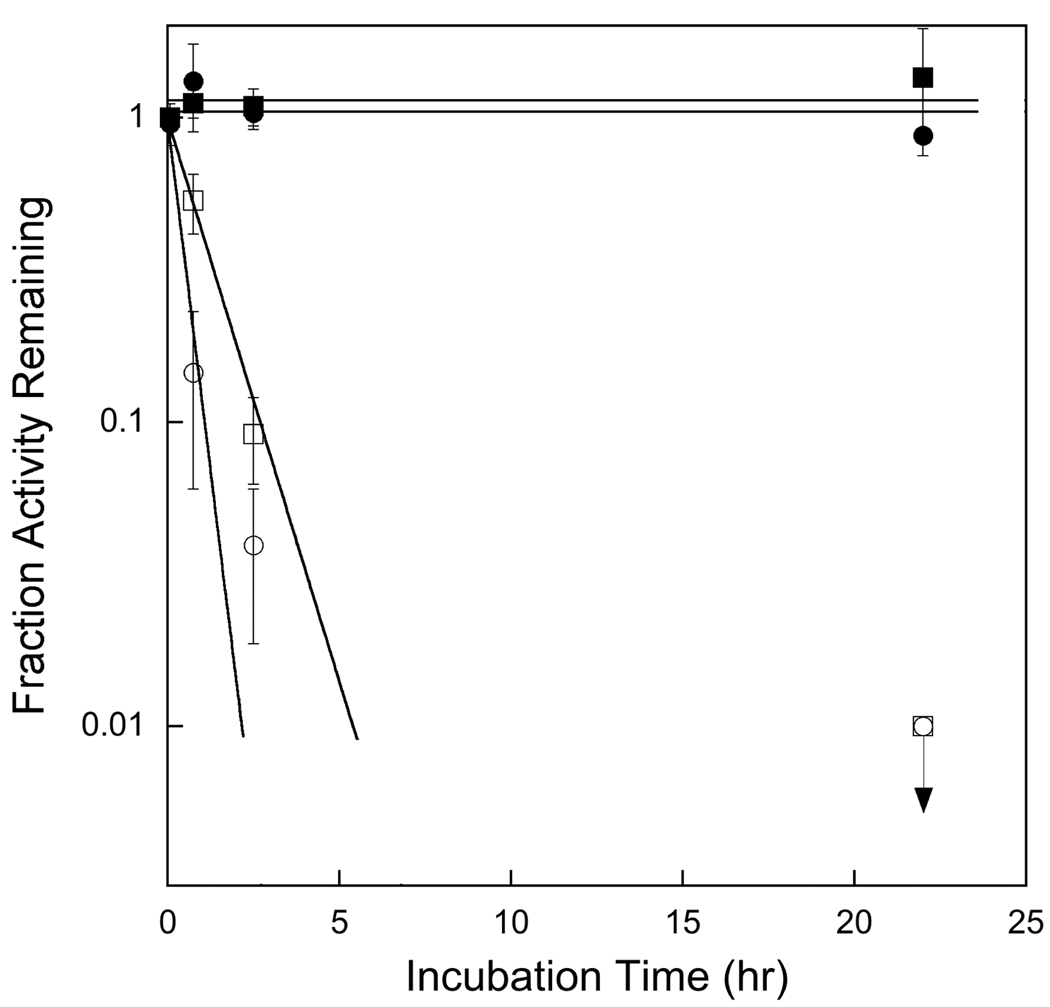
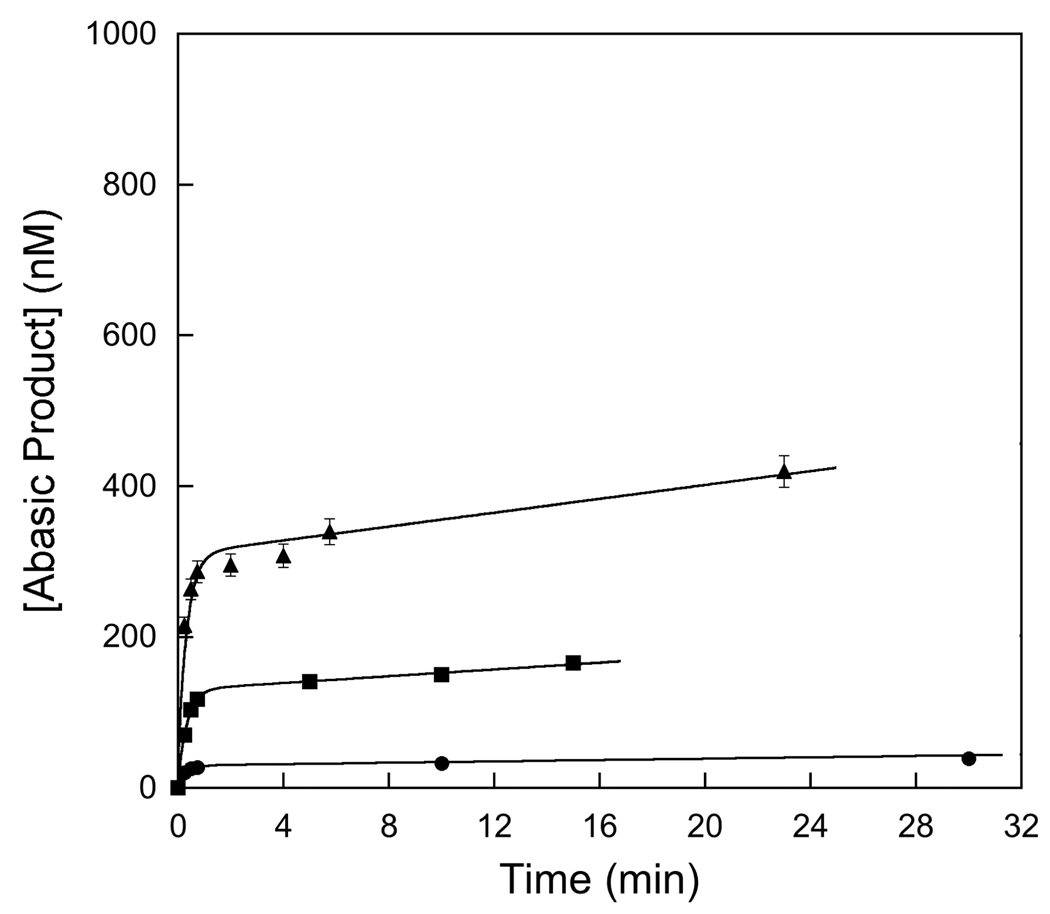
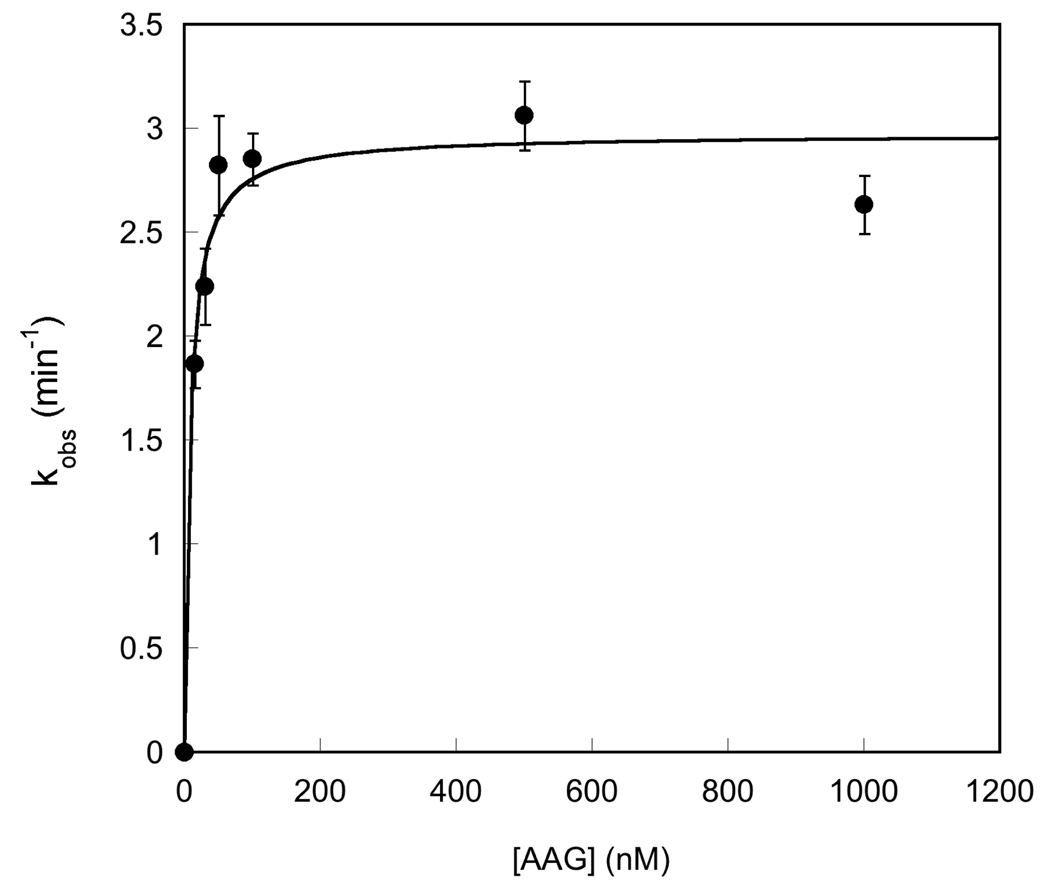
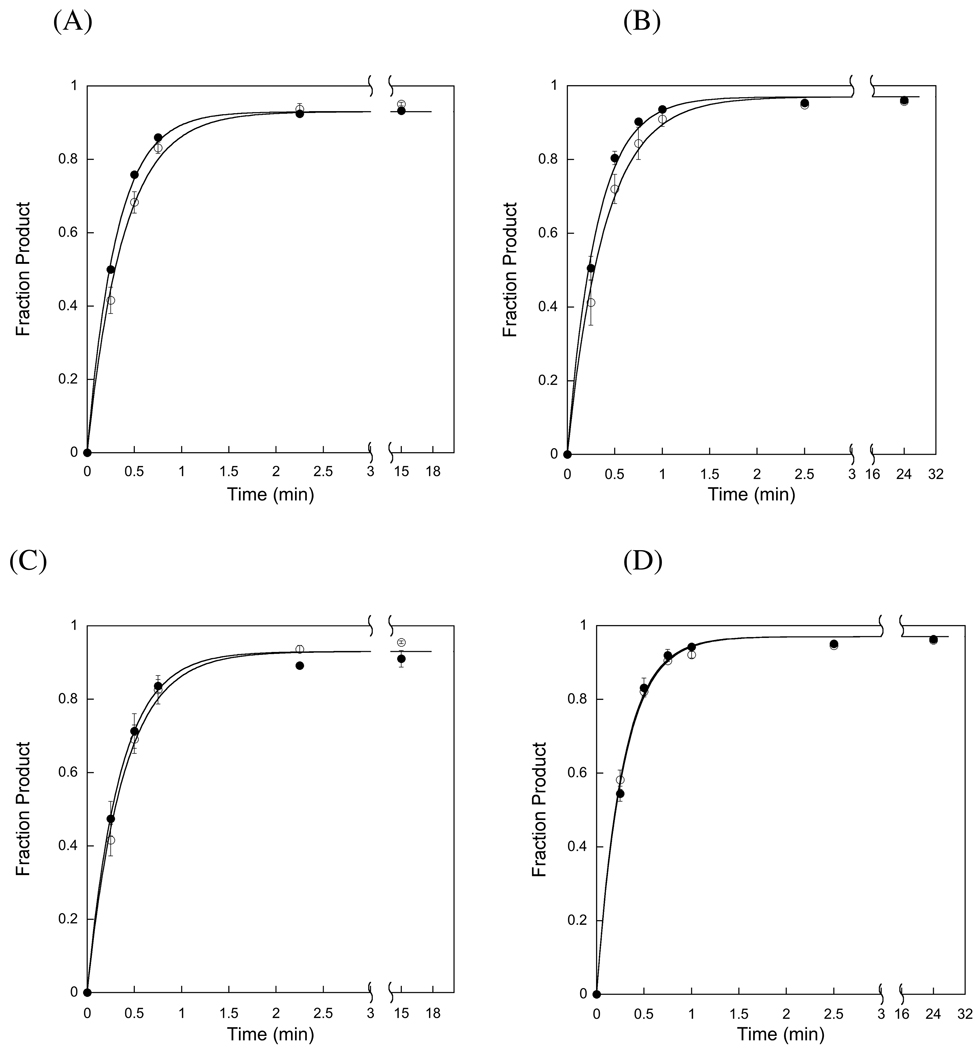
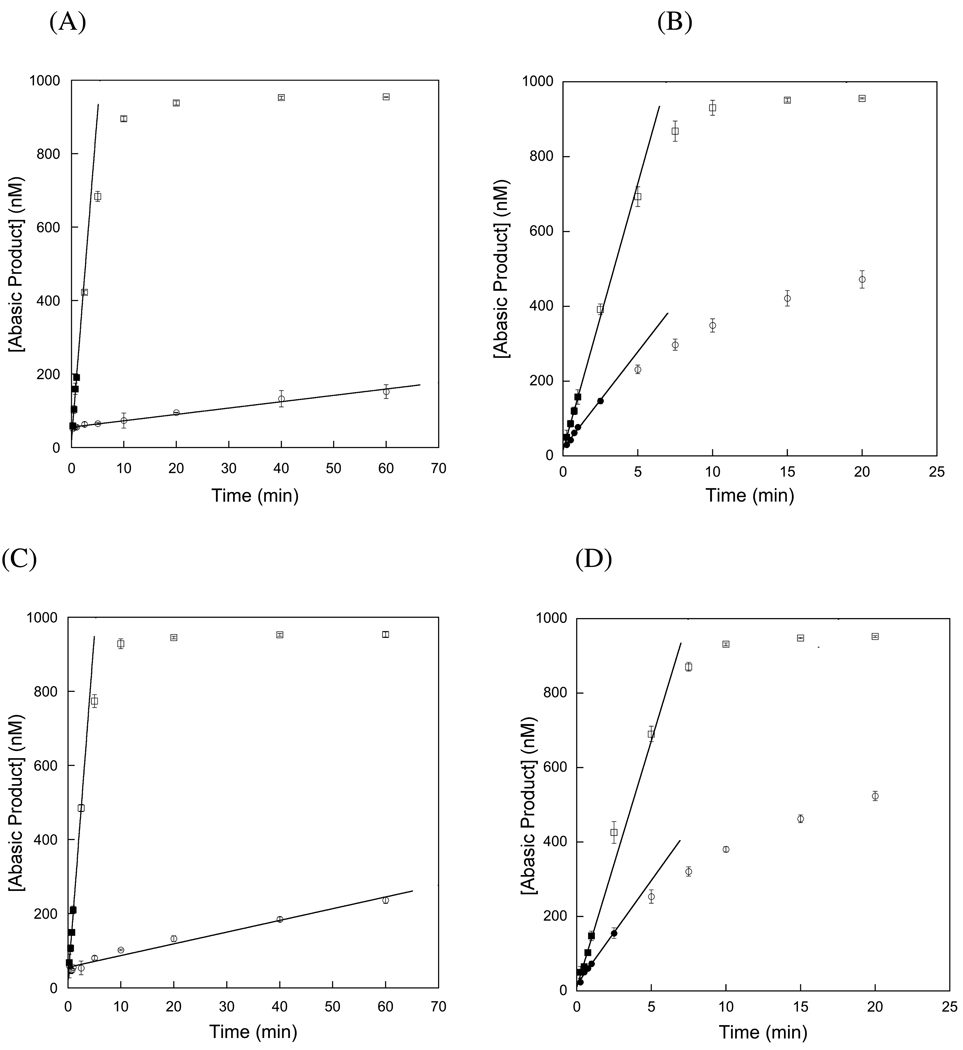
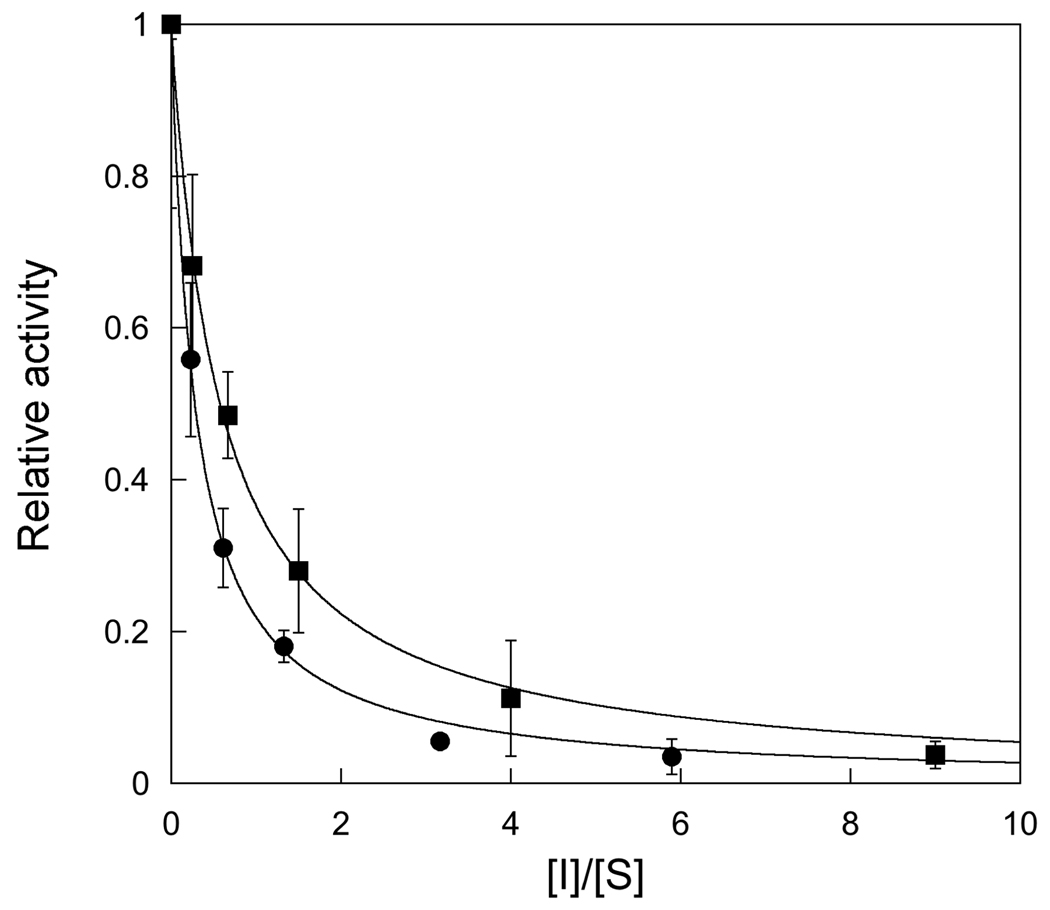
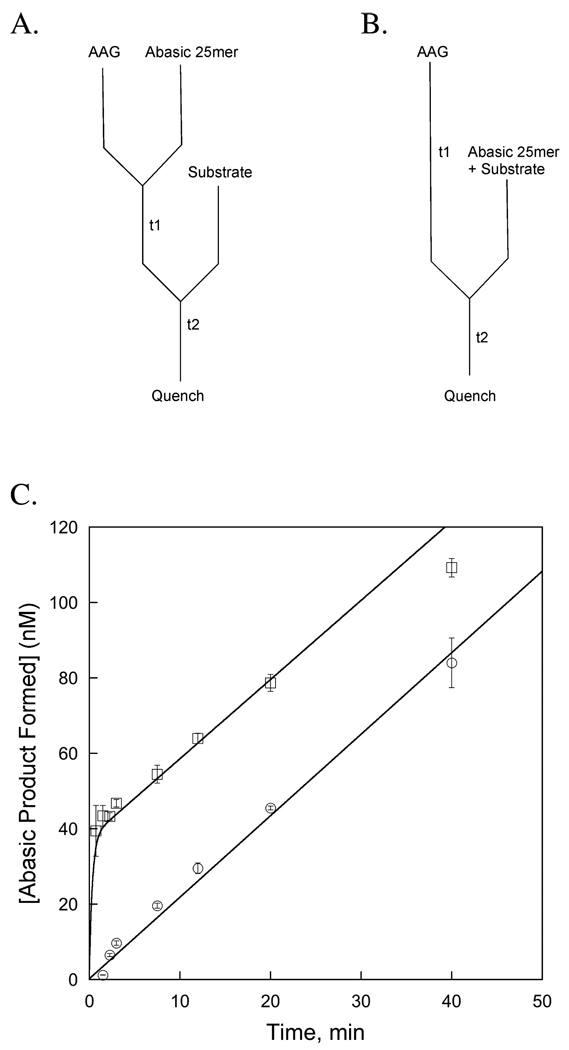
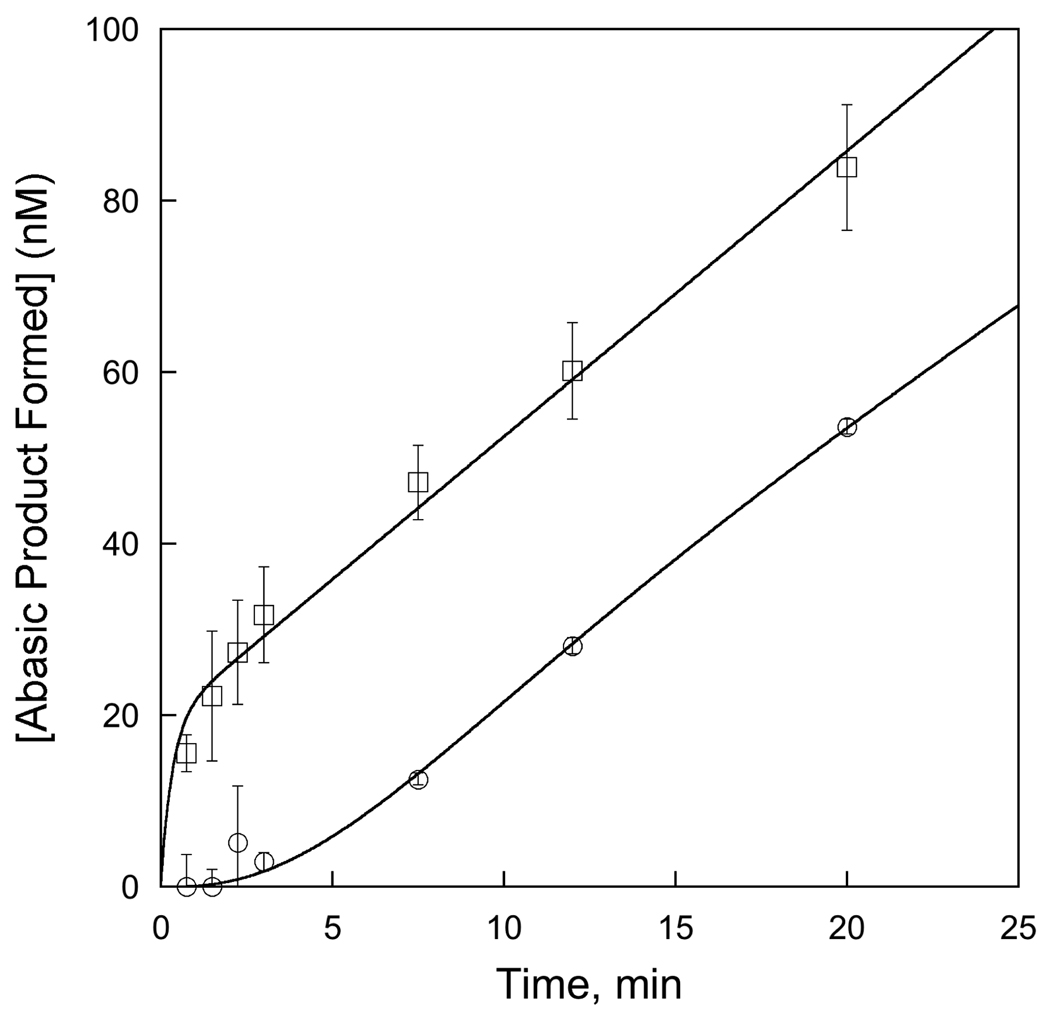
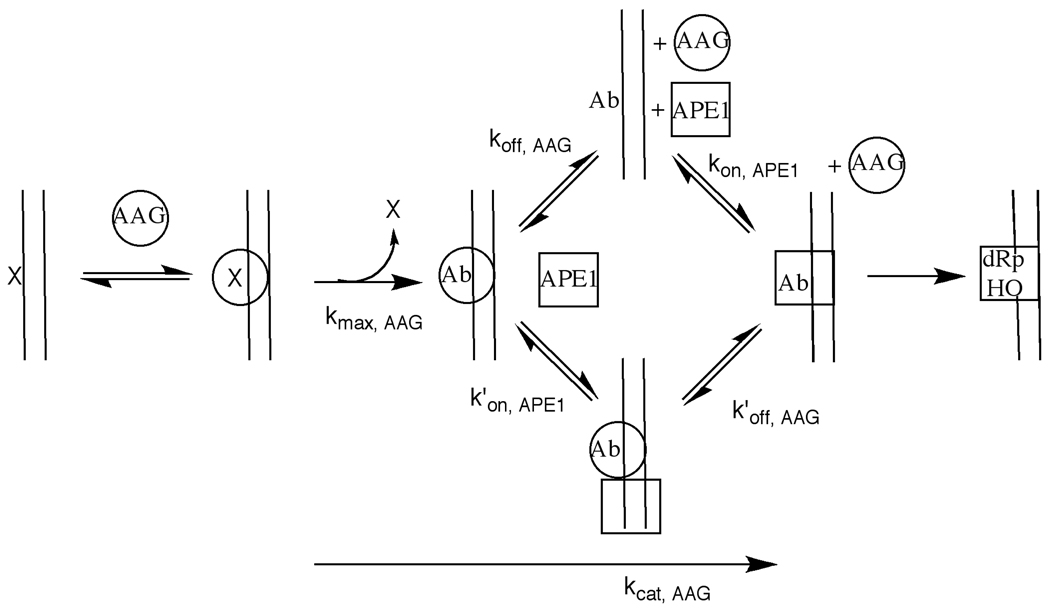
Human alkyladenine DNA glycosylase (AAG) locates and excises a wide variety of damaged purine bases from DNA, including hypoxanthine that is formed by the oxidative deamination of adenine. We used steady state, pre-steady state, and single-turnover kinetic assays to show that the multiple-turnover excision of hypoxanthine in vitro is limited by release of the abasic DNA product. This suggests the possibility that the product release step is regulated in vivo by interactions with other base excision repair (BER) proteins. Such coordination of BER activities would protect the abasic DNA repair intermediate and ensure its correct processing. AP endonuclease 1 (APE1) is the predominant enzyme for processing abasic DNA sites in human cells. Therefore, we have investigated the functional effects of added APE1 on the base excision activity of AAG. We find that APE1 stimulates the multiple-turnover excision of hypoxanthine by AAG but has no effect on single-turnover excision. Since the amino terminus of AAG has been implicated in other protein-protein interactions, we also characterize the deletion mutant lacking the first 79 amino acids. We find that APE1 fully stimulates the multiple-turnover glycosylase activity of this mutant, demonstrating that the amino terminus of AAG is not strictly required for this functional interaction. These results are consistent with a model in which APE1 displaces AAG from the abasic site, thereby coordinating the first two steps of the base excision repair pathway.


Figures

Figure 1
Figure 1
Stability of full-length AAG in the absence of DNA. AAG (20 nM) was incubated at pH 7.0 and 37 °C. The ionic strength was adjusted with sodium chloride to be low (42 mM, circles) or high (120 mM, squares). Incubations contained no additional proteins (open symbols) or were supplemented with 0.1 mg/mL BSA (closed symbols). After the indicated incubation time the multiple-turnover glycosylase activity was measured as described in the Materials and Methods. The average and standard deviation for triplicate reactions is shown. In the absence of BSA there was no detectable glycosylase activity, so only the limit of ≤1% is indicated. Single exponential fits to the activity of AAG in the absence of BSA gave half-lives of 10 and 40 minutes, respectively for low and high ionic strength. In the presence of BSA full glycosylase activity was retained for at least a day.
Figure 2
Figure 2
AAG exhibits burst kinetics. Reactions were carried out under our standard low ionic strength conditions (42 mM) with 1 µM 25mer substrate and 30 (●), 120 (■), or 300 (▲) nM full-length AAG. The reactions were performed in triplicate and the average and standard deviation are shown (in many cases the standard deviation is smaller than the symbols). The burst amplitude and steady state velocity were obtained from nonlinear least square fits to the data using Equation 5 (See Material and Methods for details). Both the burst amplitude and steady state velocity were linearly dependent upon the concentration of AAG, corresponding to a stoichiometric burst (see Supporting Information).
Figure 3
Figure 3
Saturation of the single-turnover excision of Hx by AAG. Single-turnover reactions were performed with 20 nM DNA and the concentration of AAG was varied between 20 and 1000 nM. At each concentration of AAG the entire time course was followed and fit by a single exponential (Equation 3; see the Materials and Methods for details). The ionic strength in this experiment was 120 mM, and the average and standard deviation of duplicate reactions is shown. The results indicate that the K1/2 for binding is 20 nM (Equation 4).
Figure 4
Figure 4
APE1 does not affect AAG-catalyzed single-turnover. Single-turnover reactions were carried out with either full-length (A & B) or Δ80 (C & D) AAG (1 µM) in excess over the 25mer DNA substrate (100 nM). These experiments were performed at 42 mM ionic strength (A & C) or at 120 mM ionic strength (B & D). The rates of reaction in the absence (○) and presence (●) of 2 µM APE1 were essentially identical in all cases. The lines indicate the non-linear least square fits of the equation for a single exponential (Equation 3). Representative data is shown for reactions that were carried out in duplicate and the error bars indicate the standard deviation. The rate constants obtained from this experiment were combined with additional experiments conducted under the same conditions and the average value is reported in Table 1.
Figure 5
Figure 5
APE1 increases the rate of AAG-catalyzed multiple-turnover. The 25mer Hx-containing substrate (1 µM) was incubated with 50 nM of full-length (A & B) or Δ80 (C & D) AAG at low ionic strength (A & C) and at high ionic strength (B & D) in the absence (○) or presence (□) of 2 µM APE1. In cases for which greater than 20% of the substrate was converted to product, the closed symbols indicate the points that were used to determine the initial rate. It is apparent that the amino-terminal 80 amino acids of AAG are not required for the stimulation by APE1, because the upper panels (full-length AAG) are almost identical to the lower panels (Δ80 AAG). The linear fits to the initial rates provided kcat values in the presence and absence of APE1 (Equation 1). This representative experiment was performed in triplicate, with the average and standard deviation (error bars) shown. The results from this experiment were combined with additional experiments to provide the rate constants that are reported in Table 1.
Figure 6
Figure 6
Equilibrium inhibition of AAG by its abasic DNA product. The relative affinity for substrate and inhibitor was determined for both full-length (●) and Δ80 AAG (■) by measuring the initial rate of product formation for mixtures of abasic product and substrate and plotting the relative activity (Vobs/Vmax) versus the ratio of inhibitor to substrate. The concentration of AAG was 25 nM and the total concentration of DNA was maintained at 500 nM. The concentration of abasic DNA was varied from none to 450 nM. Reactions were performed in triplicate and the error bars indicate the standard deviation from the mean. The lines indicate the best fit of Equation 8 to the data (see Materials and Methods) and yield Ki/KM ratios of 1.7 ± 0.2 for the full-length and 3.6 ± 0.2 for Δ80 AAG.
Figure 7
Figure 7
Addition of abasic DNA product is sufficient to eliminate the burst phase. The experimental design is given in part A & B. (A) AAG was preincubated with abasic 25mer product for 90 minutes (t1), after which 25mer substrate was added. Timepoints were taken during the second time period (t2) and the amount of abasic DNA product was determined with the standard DNA glycosylase assay. (B) As a reference reaction, enzyme was preincubated without DNA and the reaction was initiated by the addition of a mixture of 25mer abasic product and substrate to achieve identical conditions as in part A. The final concentrations after mixing were 50 nM AAG, 50 nM 25mer abasic DNA, and 1 uM 25mer substrate. In this representative experiment each reaction was performed in triplicate and the average and standard deviation for each time point is plotted in part C. A burst is observed when enzyme is added to the product/substrate mixture (□). No burst was observed when enzyme was first equilibrated with one equivalent of abasic DNA product (○). This confirms that the slow step in the multiple-turnover glycosylase reaction is release of the abasic DNA product, and that release of the Hx product must be as fast or faster than this step.
Figure 8
Figure 8
The rate of dissociation of the abasic DNA product limits multiple-turnover excision by AAG in the absence of APE1. We took advantage of the faster rate of dissociation of shorter DNA substrates (Table 2) to independently test our model that dissociation from the abasic DNA product is the rate-limiting step in AAG-catalyzed multiple-turnover base excision. This experiment was carried out as described for Figure 7, except that the 17mer substrate was used in place of the 25mer substrate. Since faster multiple-turnover excision is observed for the shorter duplex, a lag phase is observed in the approach to steady state (○). The lag time obtained by extrapolation of the steady-state rate is 4 ± 1 minutes in good agreement with the expected lag time of 4 minutes [lag time = 1/(koff 25mer + koff 17mer)= 3.8 minutes]. In contrast, initiation of the reaction with a mixture of 25mer product and 17mer substrate gave rise to a burst phase (□). Reactions were performed in triplicate and the standard deviation is shown. The theoretical equations that were fit to the experimental data are described in the Material and Methods.
Figure 9
Figure 9
Model for the stimulation of AAG by APE1. A simplified mechanism is presented to emphasize the role of APE1 in stimulating the reaction of AAG. Although most lesions will be encountered by a nonspecifically bound protein that is diffusing along the duplex (25), only a single binding step is shown. Similarly, a single step is shown for the excision of Hx, but it is known that N-glycosidic bond cleavage is preceded by an unfavorable flipping equilibrium and therefore the maximal single-turnover reaction includes both the nucleotide flipping and N-glycosidic bond cleavage steps (7). According to our results, the release of the Hx product (X) is shown as a rapid step. Two possible pathways for dissociation of AAG and association of APE1 are shown. In the upper pathway AAG first dissociates and then APE1 binds. In the lower pathway APE1 binds to the AAG•abasic DNA complex and somehow increases the rate constant for dissociation of AAG. Our results demonstrate that the lower pathway is preferred for both full-length and truncated AAG under the conditions tested.
Scheme 1
Scheme 1

Similar articles

Cited by

References

    1. Lindahl T, Wood RD. Quality control by DNA repair. Science. 1999;286:1897–1905. - PubMed
    1. Krokan HE, Standal R, Slupphaug G. DNA glycosylases in the base excision repair of DNA. Biochem J. 1997;325(Pt 1):1–16. - PMC - PubMed
    1. Stivers JT, Jiang YL. A mechanistic perspective on the chemistry of DNA repair glycosylases. Chem Rev. 2003;103:2729–2759. - PubMed
    1. Wood RD, Mitchell M, Lindahl T. Human DNA repair genes. Mutat Res. 2005;577:275–283. - PubMed
    1. Liu Y, Prasad R, Beard WA, Kedar PS, Hou EW, Shock DD, Wilson SH. Coordination of steps in single-nucleotide base excision repair mediated by apurinic/apyrimidinic endonuclease 1 and DNA polymerase beta. J Biol Chem. 2007;282:13532–13541. - PMC - PubMed

Publication types

MeSH terms

Substances