. 2009 Jun;131(6):061003.
doi: 10.1115/1.3118773.

Modeling the matrix of articular cartilage using a continuous fiber angular distribution predicts many observed phenomena

Affiliations

Modeling the matrix of articular cartilage using a continuous fiber angular distribution predicts many observed phenomena

Gerard A Ateshian et al. J Biomech Eng. 2009 Jun.

Abstract

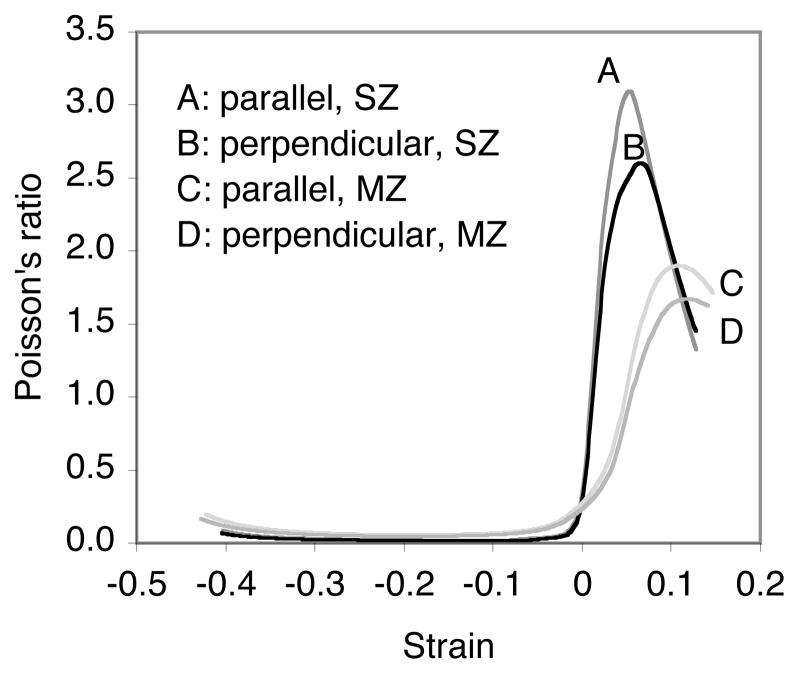
Cartilage is a hydrated soft tissue whose solid matrix consists of negatively charged proteoglycans enmeshed within a fibrillar collagen network. Though many aspects of cartilage mechanics are well understood today, most notably in the context of porous media mechanics, there remain a number of responses observed experimentally whose prediction from theory has been challenging. In this study the solid matrix of cartilage is modeled with a continuous fiber angular distribution, where fibers can only sustain tension, swelled by the osmotic pressure of a proteoglycan ground matrix. It is shown that this representation of cartilage can predict a number of observed phenomena in relation to the tissue's equilibrium response to mechanical and osmotic loading, when flow-dependent and flow-independent viscoelastic effects have subsided. In particular, this model can predict the transition of Poisson's ratio from very low values in compression (approximately 0.02) to very high values in tension (approximately 2.0). Most of these phenomena cannot be explained when using only three orthogonal fiber bundles to describe the tissue matrix, a common modeling assumption used to date. The main picture emerging from this analysis is that the anisotropy of the fibrillar matrix of articular cartilage is intimately dependent on the mechanism of tensed fiber recruitment, in the manner suggested by our recent theoretical study (Ateshian, 2007, ASME J. Biomech. Eng., 129(2), pp. 240-249).


Figures

Figure 1
Figure 1
(a) Representative stress-strain responses of human glenohumeral joint cartilage in tension and compression, from the superficial zone (SZ) and middle zone (MZ). Tensile responses are reported for cartilage strips harvested parallel and perpendicular to the local split-line direction; compressive responses are for cylindrical specimens loaded axially along the direction normal to the articular surface. From Huang et al. [26], with permission. (b) Theoretical predictions for a continuous fiber angular distribution.
Figure 1
Figure 1
(a) Representative stress-strain responses of human glenohumeral joint cartilage in tension and compression, from the superficial zone (SZ) and middle zone (MZ). Tensile responses are reported for cartilage strips harvested parallel and perpendicular to the local split-line direction; compressive responses are for cylindrical specimens loaded axially along the direction normal to the articular surface. From Huang et al. [26], with permission. (b) Theoretical predictions for a continuous fiber angular distribution.
Figure 2
Figure 2
Theoretical prediction of Poisson’s ratio for in uniaxial tension and compression using (a) a continuous fiber distribution, or (b) three orthogonal fiber bundles. SZ: superficial zone; MZ: middle zone.
Figure 2
Figure 2
Theoretical prediction of Poisson’s ratio for in uniaxial tension and compression using (a) a continuous fiber distribution, or (b) three orthogonal fiber bundles. SZ: superficial zone; MZ: middle zone.
Figure 3
Figure 3
Representative experimental tensile response data from Figure 2 of Elliott et al. [25], converted from infinitesimal strain to Lagrangian strain using the formula given by these authors, and re-plotted as lateral versus axial strain. The solid curve is the least-squares fit of a quadratic polynomial to the data. The slope of this curve is the incremental Poisson’s ratio.
Figure 4
Figure 4
Average experimental response from the study of Chahine et al. [24] on immature bovine cartilage at various NaCl bathing solution concentration, for compressive loading along the split-line direction, and lateral contraction perpendicular to it. (a) Stress versus strain. (b) Poisson’s ratio versus strain.
Figure 4
Figure 4
Average experimental response from the study of Chahine et al. [24] on immature bovine cartilage at various NaCl bathing solution concentration, for compressive loading along the split-line direction, and lateral contraction perpendicular to it. (a) Stress versus strain. (b) Poisson’s ratio versus strain.
Figure 5
Figure 5
Theoretical predictions for testing conditions similar to the study of Chahine et al. [24], using a continuous fiber angular distribution.
Figure 5
Figure 5
Theoretical predictions for testing conditions similar to the study of Chahine et al. [24], using a continuous fiber angular distribution.
Figure 6
Figure 6
(a) Stress-strain response of normal and proteoglycan-depleted bovine articular cartilage in uniaxial tension, adapted from Figure 6 of Schmidt et al. [45], with permission. (b) Theoretical simulation of similar testing conditions using a continuous fiber angular distribution.
Figure 6
Figure 6
(a) Stress-strain response of normal and proteoglycan-depleted bovine articular cartilage in uniaxial tension, adapted from Figure 6 of Schmidt et al. [45], with permission. (b) Theoretical simulation of similar testing conditions using a continuous fiber angular distribution.
Figure 7
Figure 7
(a) Equilibrium uniaxial tensile stress response of bovine articular cartilage in bathing solutions of various NaCl concentrations, under 20% isometric strain; adapted from Figure 8 of Grodzinsky et al. [46], with permission. (b) Theoretical predictions for similar testing conditions, at isometric tensile strains varying from 0.7% to 16%. NaCl concentration is in units of molarity (M). Stresses are normalized to the corresponding value achieved in the most hypotonic bath (10−4M NaCl). Black curves represent the strains for which the isometric stress decreases as the bathing solution is switched from distilled water to isotonic saline (0.15M), whereas gray curves represent those conditions where the stress correspondingly increases; this complex response is consistent with the findings of Akizuki et al. [27].
Figure 7
Figure 7
(a) Equilibrium uniaxial tensile stress response of bovine articular cartilage in bathing solutions of various NaCl concentrations, under 20% isometric strain; adapted from Figure 8 of Grodzinsky et al. [46], with permission. (b) Theoretical predictions for similar testing conditions, at isometric tensile strains varying from 0.7% to 16%. NaCl concentration is in units of molarity (M). Stresses are normalized to the corresponding value achieved in the most hypotonic bath (10−4M NaCl). Black curves represent the strains for which the isometric stress decreases as the bathing solution is switched from distilled water to isotonic saline (0.15M), whereas gray curves represent those conditions where the stress correspondingly increases; this complex response is consistent with the findings of Akizuki et al. [27].
Figure 8
Figure 8
Parametric variation of the material parameter ξi from 2MPa to 10MPa, by increments of 2MPa. (a) Sensitivity of the stress-strain response. (b) Sensitivity of the Poisson’s ratio-strain response.
Figure 8
Figure 8
Parametric variation of the material parameter ξi from 2MPa to 10MPa, by increments of 2MPa. (a) Sensitivity of the stress-strain response. (b) Sensitivity of the Poisson’s ratio-strain response.
Figure 9
Figure 9
Parametric variation of the material parameter αi from 2.0 to 3.0, by increments of 0.25. (a) Sensitivity of the stress-strain response. (b) Sensitivity of the Poisson’s ratio-strain response.
Figure 9
Figure 9
Parametric variation of the material parameter αi from 2.0 to 3.0, by increments of 0.25. (a) Sensitivity of the stress-strain response. (b) Sensitivity of the Poisson’s ratio-strain response.

References

    1. Kempson GE, Freeman MA, Swanson SA. Tensile Properties of Articular Cartilage. Nature. 1968;220(5172):1127–8. - PubMed
    1. Maroudas A. Physicochemical Properties of Cartilage in the Light of Ion Exchange Theory. Biophys J. 1968;8(5):575–95. - PMC - PubMed
    1. Cohen B, Lai WM, Mow VC. A Transversely Isotropic Biphasic Model for Unconfined Compression of Growth Plate and Chondroepiphysis. J Biomech Eng. 1998;120(4):491–6. - PubMed
    1. Soltz MA, Ateshian GA. A Conewise Linear Elasticity Mixture Model for the Analysis of Tension-Compression Nonlinearity in Articular Cartilage. J Biomech Eng. 2000;122(6):576–86. - PMC - PubMed
    1. Loret B, Simoes FMF. Mechanical Effects of Ionic Replacements in Articular Cartilage. Part I: The Constitutive Model. Biomech Model Mechanobiol. 2005;4(2–3):63–80. - PubMed

Publication types