

3D MRI-based anisotropic FSI models with cyclic bending for human coronary atherosclerotic plaque mechanical analysis
- PMID: 19449964
- PMCID: PMC2692061
- DOI: 10.1115/1.3127253
3D MRI-based anisotropic FSI models with cyclic bending for human coronary atherosclerotic plaque mechanical analysis
Abstract
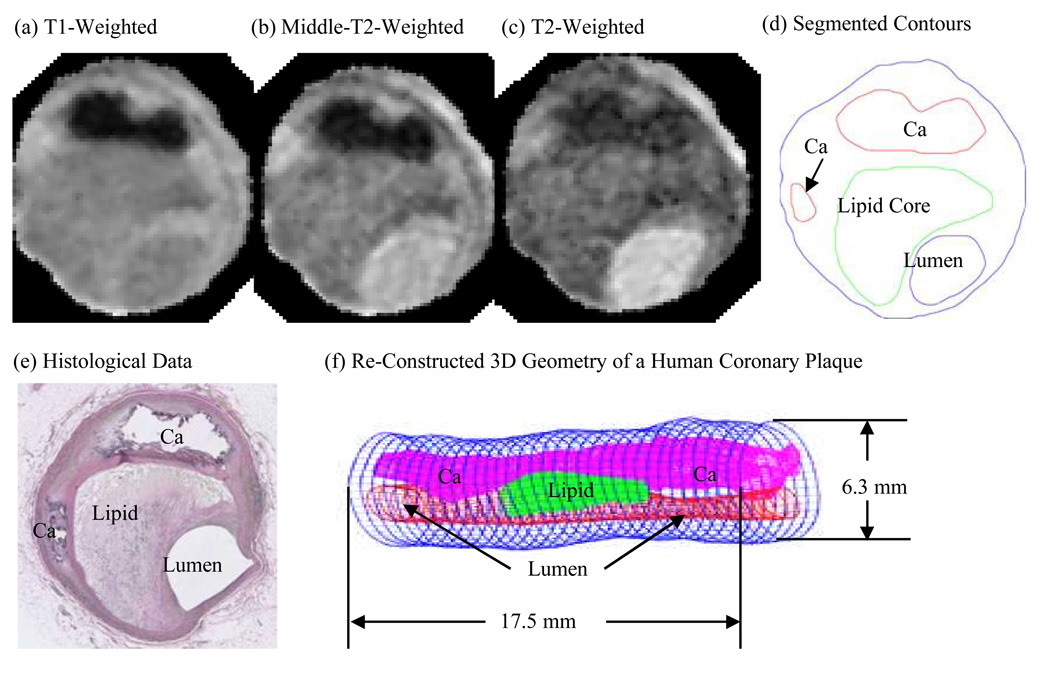
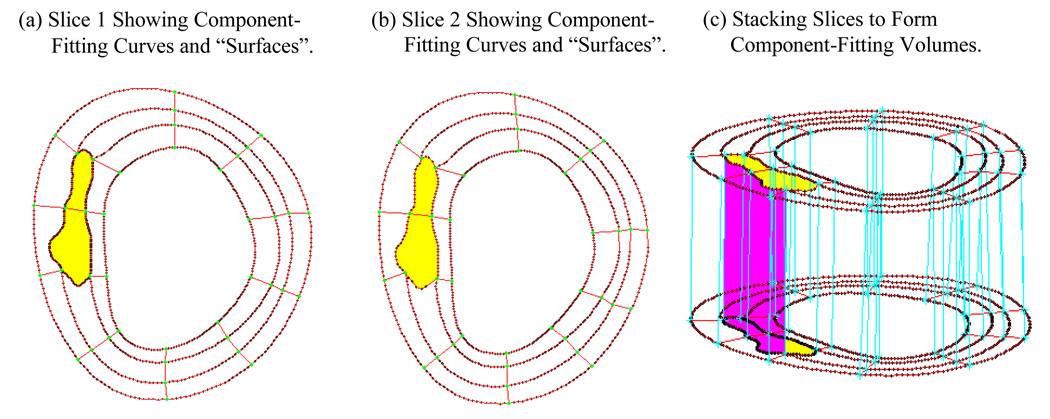
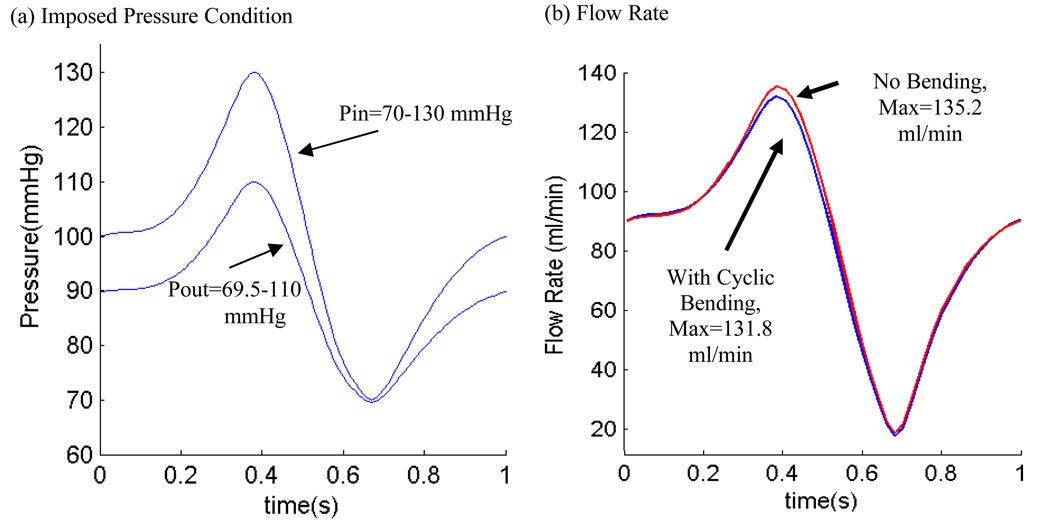
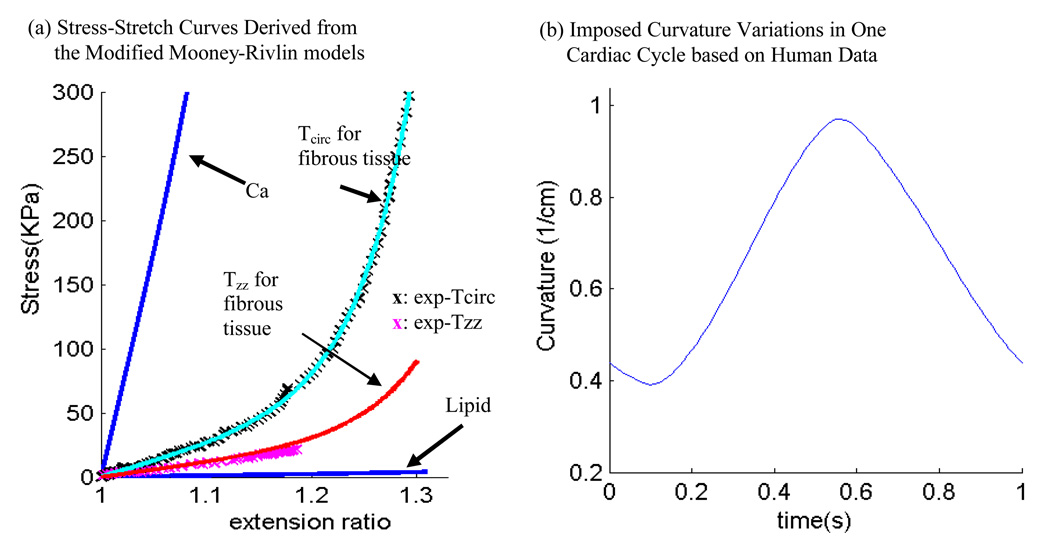
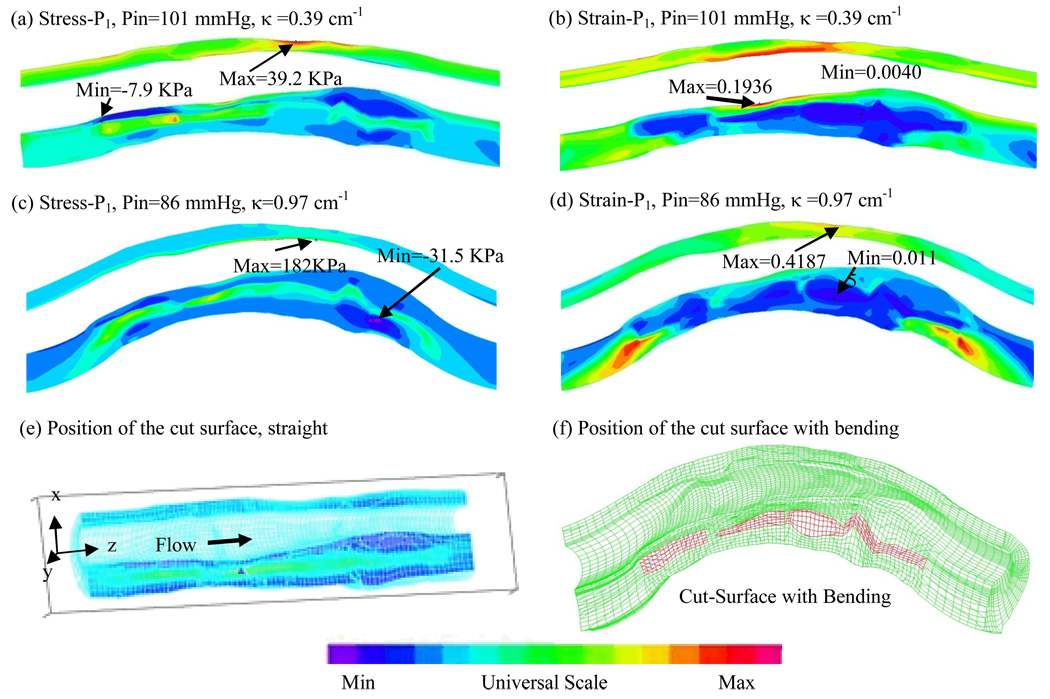
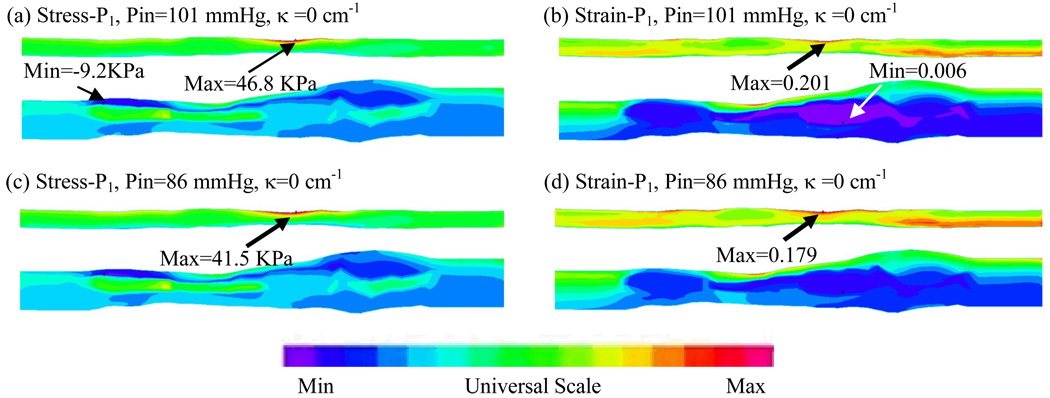
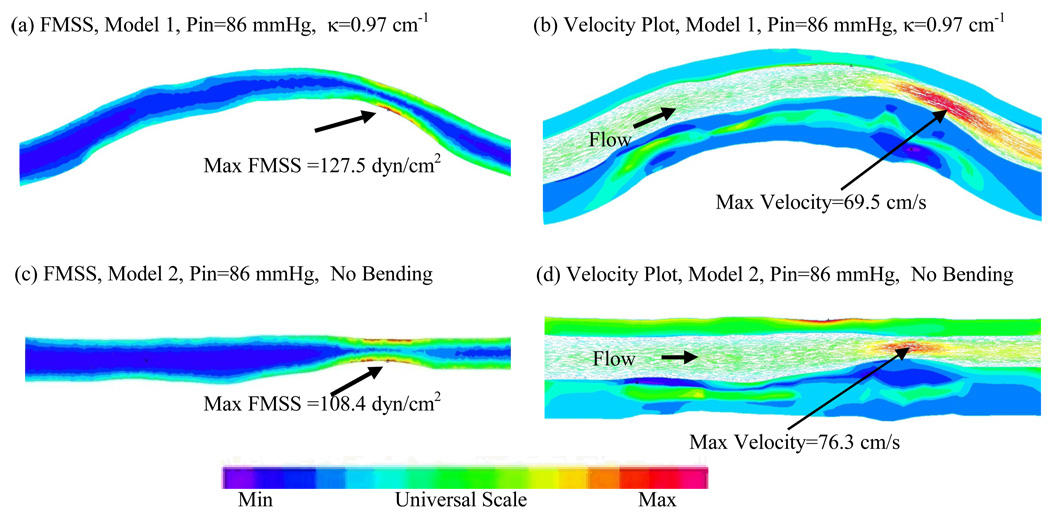
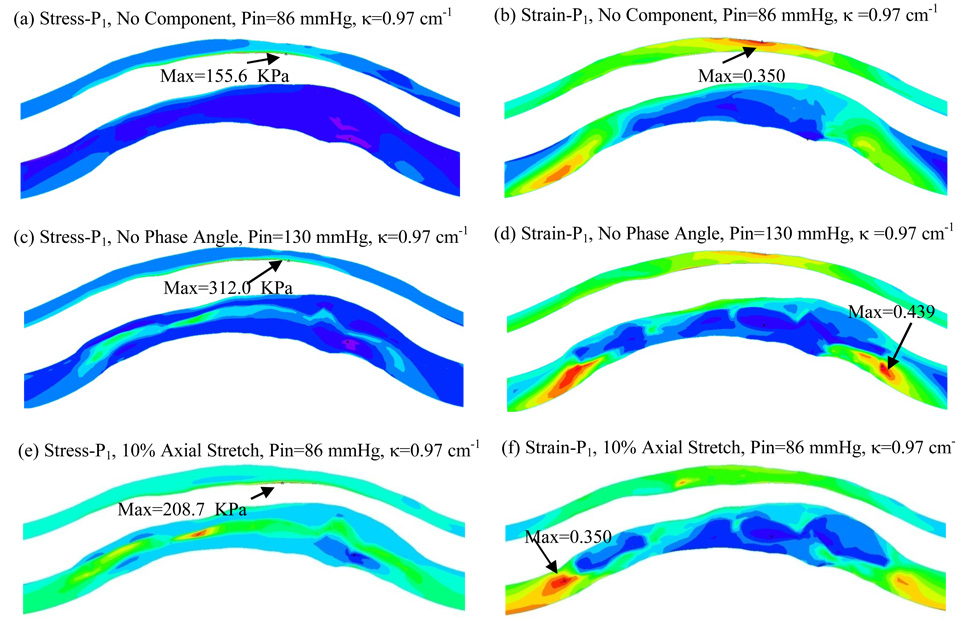
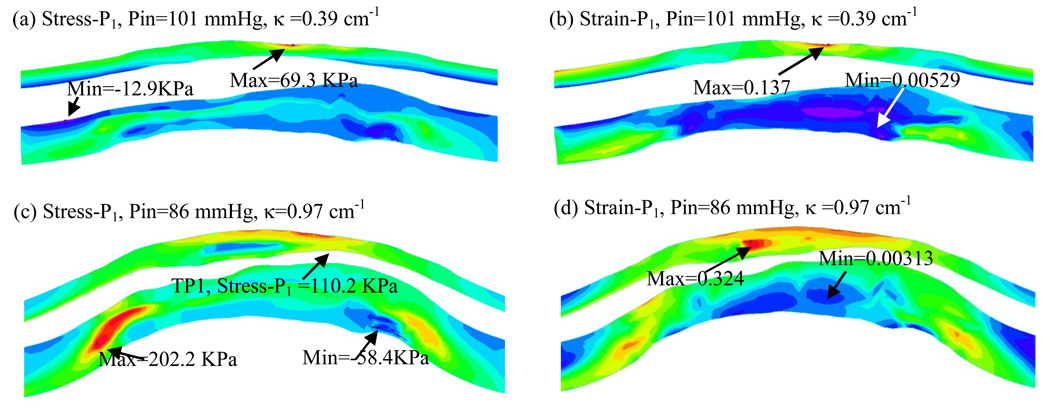
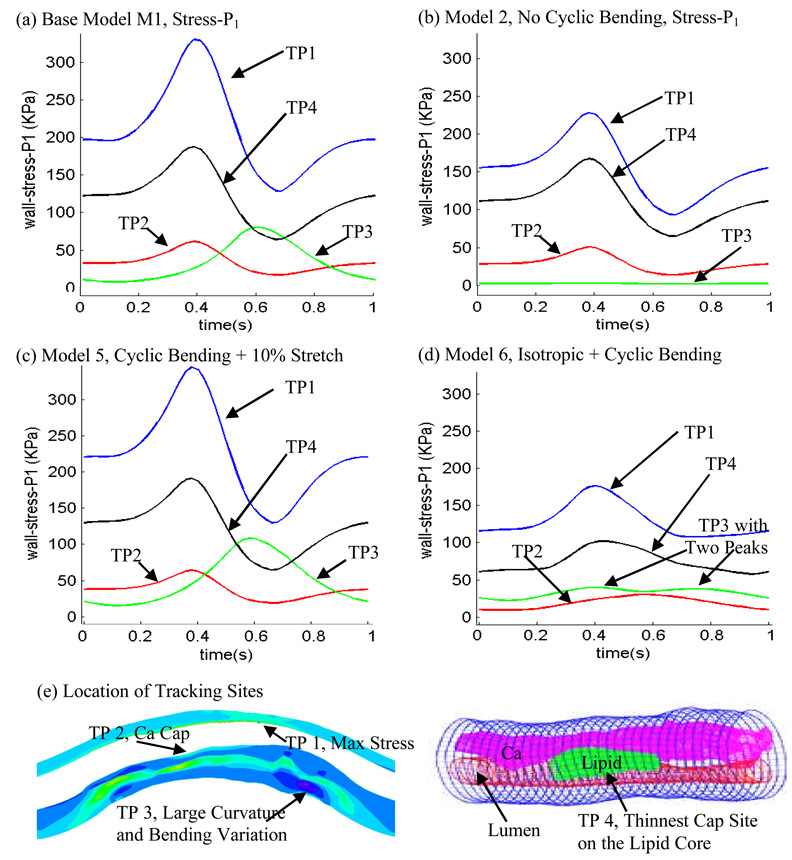
Heart attack and stroke are often caused by atherosclerotic plaque rupture, which happens without warning most of the time. Magnetic resonance imaging (MRI)-based atherosclerotic plaque models with fluid-structure interactions (FSIs) have been introduced to perform flow and stress/strain analysis and identify possible mechanical and morphological indices for accurate plaque vulnerability assessment. For coronary arteries, cyclic bending associated with heart motion and anisotropy of the vessel walls may have significant influence on flow and stress/strain distributions in the plaque. FSI models with cyclic bending and anisotropic vessel properties for coronary plaques are lacking in the current literature. In this paper, cyclic bending and anisotropic vessel properties were added to 3D FSI coronary plaque models so that the models would be more realistic for more accurate computational flow and stress/strain predictions. Six computational models using one ex vivo MRI human coronary plaque specimen data were constructed to assess the effects of cyclic bending, anisotropic vessel properties, pulsating pressure, plaque structure, and axial stretch on plaque stress/strain distributions. Our results indicate that cyclic bending and anisotropic properties may cause 50-800% increase in maximum principal stress (Stress-P1) values at selected locations. The stress increase varies with location and is higher when bending is coupled with axial stretch, nonsmooth plaque structure, and resonant pressure conditions (zero phase angle shift). Effects of cyclic bending on flow behaviors are more modest (9.8% decrease in maximum velocity, 2.5% decrease in flow rate, 15% increase in maximum flow shear stress). Inclusion of cyclic bending, anisotropic vessel material properties, accurate plaque structure, and axial stretch in computational FSI models should lead to a considerable improvement of accuracy of computational stress/strain predictions for coronary plaque vulnerability assessment. Further studies incorporating additional mechanical property data and in vivo MRI data are needed to obtain more complete and accurate knowledge about flow and stress/strain behaviors in coronary plaques and to identify critical indicators for better plaque assessment and possible rupture predictions.
Figures
Similar articles
-
Cyclic Bending Contributes to High Stress in a Human Coronary Atherosclerotic Plaque and Rupture Risk: In Vitro Experimental Modeling and Ex Vivo MRI-Based Computational Modeling Approach.Mol Cell Biomech. 2008;5(4):259-274. Mol Cell Biomech. 2008. PMID: 19412353 Free PMC article.
-
In vivo IVUS-based 3-D fluid-structure interaction models with cyclic bending and anisotropic vessel properties for human atherosclerotic coronary plaque mechanical analysis.IEEE Trans Biomed Eng. 2009 Oct;56(10):2420-8. doi: 10.1109/TBME.2009.2025658. Epub 2009 Jun 26. IEEE Trans Biomed Eng. 2009. PMID: 19567341 Free PMC article.
-
Patient-specific artery shrinkage and 3D zero-stress state in multi-component 3D FSI models for carotid atherosclerotic plaques based on in vivo MRI data.Mol Cell Biomech. 2009 Jun;6(2):121-34. Mol Cell Biomech. 2009. PMID: 19444328 Free PMC article.
-
MRI-based biomechanical parameters for carotid artery plaque vulnerability assessment.Thromb Haemost. 2016 Mar;115(3):493-500. doi: 10.1160/TH15-09-0712. Epub 2016 Jan 21. Thromb Haemost. 2016. PMID: 26791734 Review.
-
Compressive mechanical properties of atherosclerotic plaques--indentation test to characterise the local anisotropic behaviour.J Biomech. 2014 Mar 3;47(4):784-92. doi: 10.1016/j.jbiomech.2014.01.018. Epub 2014 Jan 13. J Biomech. 2014. PMID: 24480703 Review.
Cited by
-
Intraplaque hemorrhage is associated with higher structural stresses in human atherosclerotic plaques: an in vivo MRI-based 3D fluid-structure interaction study.Biomed Eng Online. 2010 Dec 31;9:86. doi: 10.1186/1475-925X-9-86. Biomed Eng Online. 2010. PMID: 21194481 Free PMC article.
-
A comprehensive fluid-structure interaction model of the left coronary artery.J Biomech Eng. 2018 Jul 5:10.1115/1.4040776. doi: 10.1115/1.4040776. Online ahead of print. J Biomech Eng. 2018. PMID: 30029208 Free PMC article.
-
Automated Coronary Optical Coherence Tomography Feature Extraction with Application to Three-Dimensional Reconstruction.Tomography. 2022 May 17;8(3):1307-1349. doi: 10.3390/tomography8030108. Tomography. 2022. PMID: 35645394 Free PMC article.
-
Impact of Fiber Structure on the Material Stability and Rupture Mechanisms of Coronary Atherosclerotic Plaques.Ann Biomed Eng. 2017 Jun;45(6):1462-1474. doi: 10.1007/s10439-017-1827-3. Epub 2017 Mar 30. Ann Biomed Eng. 2017. PMID: 28361184 Free PMC article.
-
Stability of carotid artery under steady-state and pulsatile blood flow: a fluid-structure interaction study.J Biomech Eng. 2015 Jun;137(6):061007. doi: 10.1115/1.4030011. Epub 2015 Mar 25. J Biomech Eng. 2015. PMID: 25761257 Free PMC article.
References
-
- American Heart Association. Heart Disease and Stroke Statistics – 2003 Update. Dallas Tex: American Heart Association; 2003.
-
- Fuster V, Cornhill JF, Dinsmore RE, Fallon JT, Insull W, Libby P, Nissen S, Rosenfeld ME, Wagner WD, editors. The Vulnerable Atherosclerotic Plaque: Understanding, Identification, and Modification. Armonk NY: Futura Publishing; 1998.
-
- Fuster V, Stein B, Ambrose JA, Badimon L, Badimon JJ, Chesebro JH. Atherosclerotic Plaque Rupture and Thrombosis, Evolving Concept. Circulation. 1990;82 Supplement II:II-47–II-59. - PubMed
-
- Giddens DP, Zarins CK, Glagov S. The Role of Fluid Mechanics in the Localization and Detection of Atherosclerosis. J. Biomech. Engng. 1993;115:588–594. - PubMed
-
- Naghavi M, Libby P, Falk E, Casscells SW, Litovsky S, Rumberger J, Badimon JJ, Stefanadis C, Moreno P, Pasterkamp G, Fayad Z, Stone PH, Waxman S, Raggi P, Madjid M, Zarrabi A, Burke A, Yuan C, Fitzgerald PJ, Siscovick DS, de Korte CL, Aikawa M, Juhani Airaksinen KE, Assmann G, Becker CR, Chesebro JH, Farb A, Galis ZS, Jackson C, Jang IK, Koenig W, Lodder RA, March K, Demirovic J, Navab M, Priori SG, Rekhter MD, Bahr R, Grundy SM, Mehran R, Colombo A, Boerwinkle E, Ballantyne C, Insull W, Jr, Schwartz RS, Vogel R, Serruys PW, Hansson GK, Faxon DP, Kaul S, Drexler H, Greenland P, Muller JE, Virmani R, Ridker PM, Zipes DP, Shah PK, Willerson JT. From Vulnerable Plaque to Vulnerable Patient: a Call for New Definitions and Risk Assessment Strategies: I. Circulation. 2003;108(14):1664–1672. - PubMed
Publication types
MeSH terms
Grants and funding
LinkOut - more resources
Full Text Sources
Other Literature Sources
Medical
