. 2009 Jun 27;364(1524):1711-23.
doi: 10.1098/rstb.2008.0219.

Cascading extinctions and community collapse in model food webs

Affiliations

Cascading extinctions and community collapse in model food webs

Jennifer A Dunne et al. Philos Trans R Soc Lond B Biol Sci. .

Abstract

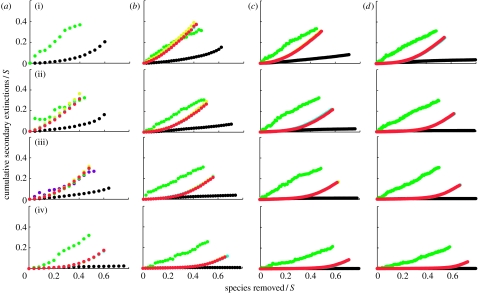
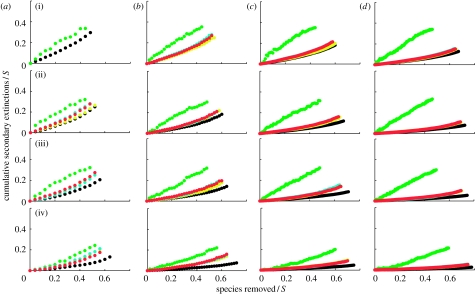
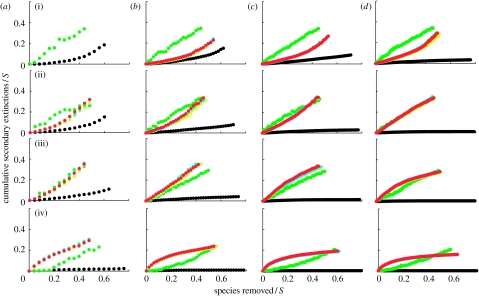
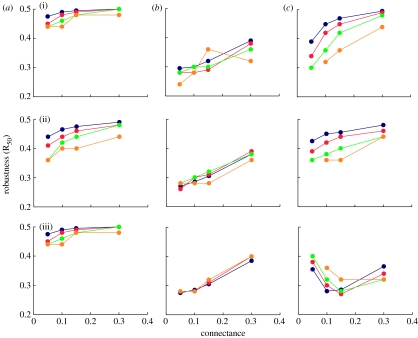
Species loss in ecosystems can lead to secondary extinctions as a result of consumer-resource relationships and other species interactions. We compare levels of secondary extinctions in communities generated by four structural food-web models and a fifth null model in response to sequential primary species removals. We focus on various aspects of food-web structural integrity including robustness, community collapse and threshold periods, and how these features relate to assumptions underlying different models, different species loss sequences and simple measures of diversity and complexity. Hierarchical feeding, a fundamental characteristic of food-web structure, appears to impose a cost in terms of robustness and other aspects of structural integrity. However, exponential-type link distributions, also characteristic of more realistic models, generally confer greater structural robustness than the less skewed link distributions of less realistic models. In most cases for the more realistic models, increased robustness and decreased levels of web collapse are associated with increased diversity, measured as species richness S, and increased complexity, measured as connectance C. These and other results, including a surprising sensitivity of more realistic model food webs to loss of species with few links to other species, are compared with prior work based on empirical food-web data.


Figures

Figure 1
Figure 1
Secondary extinctions resulting from the primary loss of most-connected species. S refers to species richness and C refers to connectance. The generalized cascade data (yellow circles) and nested hierarchy data (blue circles) are generally obscured by overlapping niche model data (red circles). The cascade data are shown by the upper green circles and the random beta data are shown by the lower black circles that sometimes overlap the lower border of the graph when there are no secondary extinctions. Each data point represents a mean across 500 model webs. Panels are shown in order of increasing connectance ((i) C=0.05, (ii) C=0.10, (iii) C=0.15 and (iv) C=0.30) and increasing species richness ((a) S=25, (b) S=50, (c) S=100 and (d) S=200). Secondary extinction curves end at the point at which approximately 80% of all taxa have gone extinct.
Figure 2
Figure 2
Secondary extinctions resulting from the primary loss of random species. S refers to species richness and C refers to connectance. The generalized cascade data (yellow circles) and nested hierarchy data (blue circles) are generally obscured by overlapping niche model data (red circles). The cascade data are shown by the upper green circles and the random beta data are shown by the lower black circles that sometimes overlap the lower border of the graph when there are no secondary extinctions. Each data point represents the mean of 10 random deletion sequences in 50 model webs. Panels are shown in order of increasing connectance ((i) C=0.05, (ii) C=0.10, (iii) C=0.15 and (iv) C=0.30) and increasing species richness ((a) S=25, (b) S=50, (c) S=100 and (d) S=200). Secondary extinction curves end at the point at which approximately 80% of all taxa have gone extinct.
Figure 3
Figure 3
Secondary extinctions resulting from the primary loss of least-connected species. S refers to species richness and C refers to connectance. The generalized cascade data (yellow circles) and nested hierarchy data (blue circles) are generally obscured by overlapping niche model data (red circles). The cascade data are shown by the upper green circles and the random beta data are shown by the lower black circles that sometimes overlap the lower border of the graph when there are no secondary extinctions. Each data point represents a mean across 500 model webs. Panels are shown in order of increasing connectance ((i) C=0.05, (ii) C=0.10, (iii) C=0.15 and (iv) C=0.30) and increasing species richness ((a) S=25, (b) S=50, (c) S=100 and (d) S=200). Secondary extinction curves end at the point at which approximately 80% of all taxa have gone extinct.
Figure 4
Figure 4
Robustness of model food webs to primary species loss. R50 refers to the proportion of species that have to undergo primary removal to achieve a total loss of at least 50% of taxa (primary removals plus secondary extinctions). Panels in columns (a), (b) and (c) show results for the random beta, cascade and niche models respectively. Results are not shown for the generalized cascade or nested hierarchy models because they are nearly indistinguishable from niche model results (figures 1–3). Different coloured lines (blue, S=200; red, S=100; green, S=50; orange, S=25) show robustness trends for different levels of species richness (S) as a function of increasing connectance. Panels in rows (i), (ii) and (iii) show results for loss of most-connected, random and least-connected species respectively. Data points represent means across 500 model webs (for most- and least-connected removal sequences) or means for 10 random removal sequences in 50 model webs.
Figure 5
Figure 5
Collapse of model food webs in response to species loss. WC80 refers to the proportion of 500 webs that have completely collapsed at the point at which 80% of total taxa in the webs have gone extinct. Panels in columns (a), (b), (c), (d) and (e) show results for the random beta, cascade, niche, generalized cascade and nested hierarchy models respectively. Panels in rows (i), (ii) and (iii) show results for loss of most-connected, random and least-connected species respectively. Different coloured lines (blue circles, S=200; red circles, S=100; green circles, S=50; orange circles, S=25) show web collapse trends for different levels of species richness (S) as a function of increasing connectance. Data points represent means across 500 model webs (for most- and least-connected removal sequences) or means for 10 random removal sequences in 50 model webs.

References

    1. Albert R., Barabási A.-L. Statistical mechanics of complex networks. Rev. Mod. Phys. 2002;74:47–97. doi:10.1103/RevModPhys.74.47 - DOI
    1. Albert R., Jeong H., Barabási A.-L. Error and attack tolerance of complex networks. Nature. 2000;406:378–382. doi:10.1038/35019019 - DOI - PubMed
    1. Allesina S., Bodini A. Who dominates whom in the ecosystem? Energy flow bottlenecks and cascading extinctions. J. Theor. Biol. 2004;230:351–358. doi:10.1016/j.jtbi.2004.05.009 - DOI - PubMed
    1. Allesina A., Alonso D., Pascual M. A general model for food web structure. Science. 2008;320:658–661. doi:10.1126/science.1156269 - DOI - PubMed
    1. Biesmeijer J.C., et al. Parallel declines in pollinators and insect-pollinated plants in Britain and The Netherlands. Science. 2006;313:351–354. doi:10.1126/science.1127863 - DOI - PubMed

Publication types

LinkOut - more resources