Review
. 2009 Jun 27;364(1524):1755-79.
doi: 10.1098/rstb.2008.0222.

Parallel ecological networks in ecosystems

Affiliations
Review

Parallel ecological networks in ecosystems

Han Olff et al. Philos Trans R Soc Lond B Biol Sci. .

Abstract

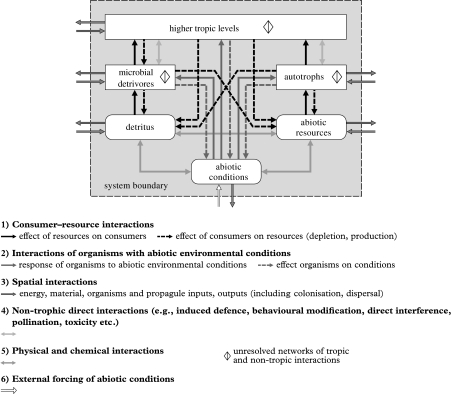
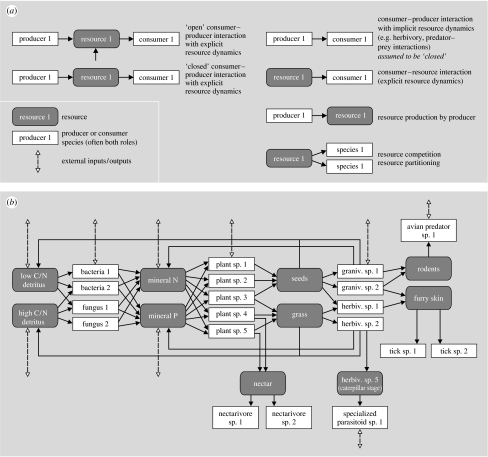
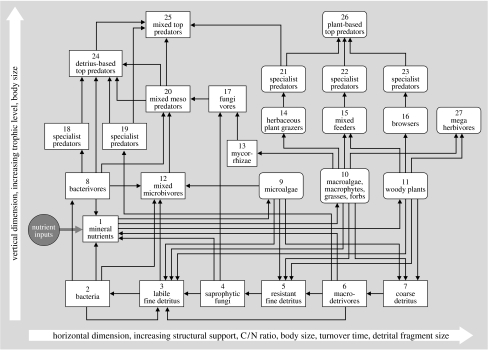
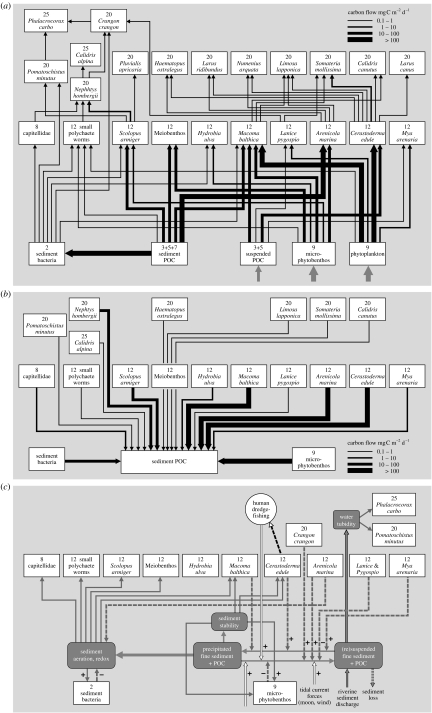
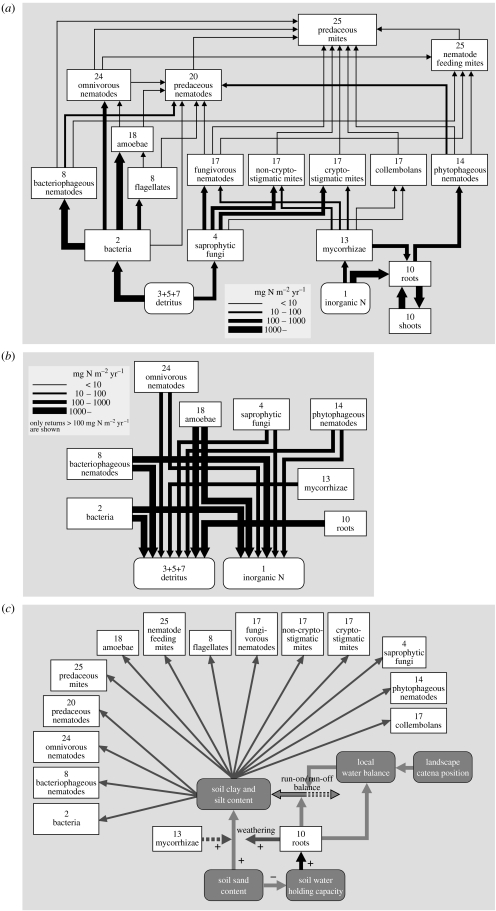
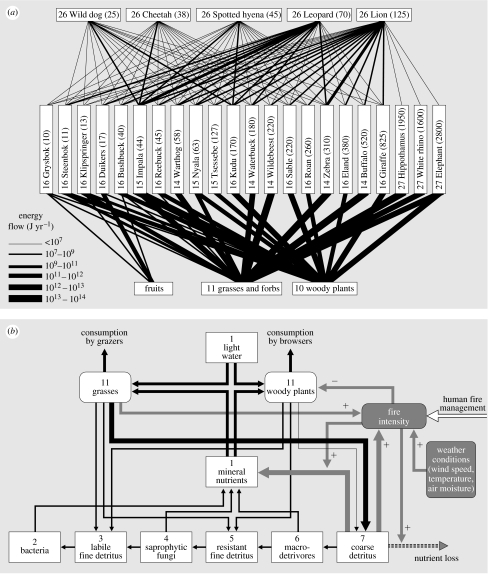
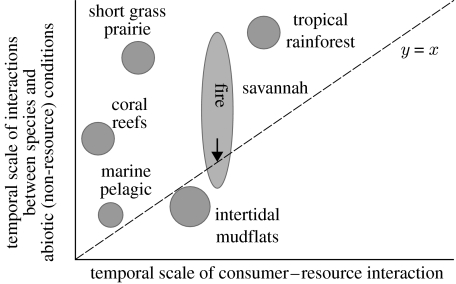
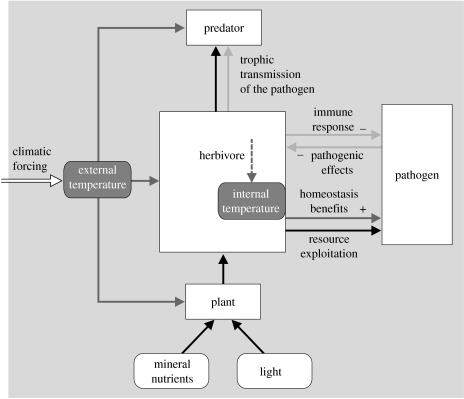
In ecosystems, species interact with other species directly and through abiotic factors in multiple ways, often forming complex networks of various types of ecological interaction. Out of this suite of interactions, predator-prey interactions have received most attention. The resulting food webs, however, will always operate simultaneously with networks based on other types of ecological interaction, such as through the activities of ecosystem engineers or mutualistic interactions. Little is known about how to classify, organize and quantify these other ecological networks and their mutual interplay. The aim of this paper is to provide new and testable ideas on how to understand and model ecosystems in which many different types of ecological interaction operate simultaneously. We approach this problem by first identifying six main types of interaction that operate within ecosystems, of which food web interactions are one. Then, we propose that food webs are structured among two main axes of organization: a vertical (classic) axis representing trophic position and a new horizontal 'ecological stoichiometry' axis representing decreasing palatability of plant parts and detritus for herbivores and detrivores and slower turnover times. The usefulness of these new ideas is then explored with three very different ecosystems as test cases: temperate intertidal mudflats; temperate short grass prairie; and tropical savannah.


Figures

Figure 1
Figure 1
A proposed general framework of ecological networks, indicating the dual detrital versus primary producer pathways of energy and nutrient flow that sustains higher trophic levels. Boxes represent basic compartment types or factors, and different types of arrow represent six main types of interaction that structure ecological networks. Some compartments may contain an unresolved web of interactions, based on consumer–resource interactions and non-trophic direct interactions.
Figure 2
Figure 2
(a) Definition of basic interaction types between producers, resources and consumers and (b) an example ecological network based on these interactions. The key point is the separation between species, and the resources that they produce and consume. These resources can be assessed implicitly and explicitly. Multiple species can contribute to the same resource compartment or class, and multiple consumers can exploit resources, irrespective of the species that contributed to or forms the resource compartment. graniv., granivorous; herbiv, herbivorous; sp, species.
Figure 3
Figure 3
A proposed general functional group classification for food webs, intended for comparing food web structure between ecosystems. The compartments are linked by trophic interactions and detritus production (figure 1), the basic interactions that structure food webs. The compartments are arranged along two main axes of organization. The vertical axes reflects the approximate trophic position of species, arranged from low (bottom) to high (top), generally leading to an increase in body size. The horizontal axis reflects a stoichiometric axis, reflecting a larger size, coarser structure, higher carbon:nutrient ratios and slower turnover of the primary produces along the axis from left to right (increasing structural support). Associated with increasing body size is a greater ability of detrivores and herbivores to ingest and digest poorer and coarser quality food, and lower per mass energy and nutrient requirements of these organisms. As a result of the processes that change along both axes, the body size of organisms increases from bottom left to top right in the scheme. See figure 1 for the interpretation of the different types of arrow.
Figure 4
Figure 4
The general framework for studying ecological networks (figures 1 and 2), as applied to the soft-bottom intertidal mudflat ecosystem of the Wadden Sea (Sylt-Rømø part, Denmark). This ecosystem consists of several subwebs. The interactions for the ‘Arenicola flats’ subweb are presented here. (a) The interaction web based on consumer–resource interactions (food web), where the topology of the web and the weight of the interactions (presented here as carbon flow, in mgC m2 d−1) is based on measured fluxes as presented by Baird et al. (2007). (b) The interaction web for the same ecosystem drawn for the detritus production part of consumer–resource interactions, based on measured fluxes as presented by Baird et al. (2007). (c) The inferred interaction web for the same ecosystem for other than consumer–resource interactions, drawn for important effects of species on abiotic conditions (ecosystem engineering), response of species to abiotic conditions, external forcing, material inputs and losses, and various physical and chemical interactions, based on information from various sources (Whitlatch 1981; Flach 1992; Herman et al. 1999; Widdows et al. 2004; Coco et al. 2006; Huxham et al. 2006; Lumborg et al. 2006). The key interaction in this web is the effect of organisms on physical conditions. Specifically, the web outlines the influence of organisms on the sedimentation rate of fine sediment versus its resuspension, where some biota promote the sedimentation, while others promote or inhibits its resuspension. Interaction weights were not available for the interaction web shown in (c). Numbers inside each box indicate the trophic functional group (figure 2). See figure 1 for the interpretation of the different types of arrow.
Figure 5
Figure 5
The general framework for studying ecological networks (figures 1 and 2), as applied to the soil subweb of the short-grass plains ecosystem of Colorado, USA (Central Plains Experimental Range). (a) The interaction web based on consumer–resource interactions (food web), where the interaction topology and weights (presented here as nitrogen flow, in mgN m2 yr−1) is based on measured and calculated fluxes as presented by Hunt et al. (1987). (b) The detritus-production part of the consumer–resource interaction web (in mgN m2 yr−1), based on measured and calculated fluxes as presented by Hunt et al. (1987). Only returns greater than 100 mg N m2 yr−1 are shown. (c) The interaction web for the same ecosystem based on species effects on abiotic conditions and species responses to abiotic conditions, as inferred from information provided for this ecosystem by Hook & Burke (2000), and general information for other drylands (van Breemen 1993; Austin et al. 2004). The key process here is the modification of soil texture by plants and fungi (through effects on weathering and run-on/run-off balance, and the high sensitivity of soil biota to texture. Interaction weights were not available for the interaction web shown in (c). Numbers inside each box indicate the trophic functional group (figure 2). See figure 1 for the interpretation of the different types of arrow.
Figure 6
Figure 6
The general framework for studying ecological networks (figures 1 and 2), as applied to the savannah ecosystem of Kruger National Park, South Africa. (a) The subweb of consumer–resource interactions that involves larger mammalian herbivores and their predators. The interaction topology and weights (presented here as annual energy flow, in J yr−1) for the herbivore–predator interactions is from the data presented by Owen-Smith & Mills (2008a), where feeding rates based on meat were converted to energy flows, using a conversion of 1 kg meat=23 600 J (Karasov & Martinez del Rio 2007). The energy flow (J d−1) between all plants and each herbivore population was first calculated allometrically as N×7940 W0.646 (Demment & van Soest 1985), where W is the body mass of the herbivore (g) and N is the population density, as reported by Owen-Smith & Mills (2008a). Then, this total energy flow per herbivore species was partitioned over its three main food item classes according to the proportional diets given by Gagnon & Chew (2000). (b) The interaction web for the same ecosystem based on physical and chemical interactions, detritus-based consumer–resource interactions, and interactions between organisms and abiotic (non-resource) conditions. The key process here is the role of fire, short-cutting nutrients away from the horizontal decomposition pathway (figure 2), making nutrients partly directly available to plants through burning off energy and carbon, while partly stimulating nutrient losses through ash run-off and gaseous losses. Also, fire kills (especially young) trees, while grasses are much more resistant to fire (Bond & Vanwilgen 1996). The higher coarse detritus production by grasses compared with trees increases the fuel loads, which promotes fires, benefiting grasses in competition with trees for light and water. On the other hand, if trees manage to outshade grasses during long fire intervals, then the fuel load is highly reduced, and fires become permanently suppressed. Also, high grazer densities can deplete grass biomass, which suppresses fires, and can lead to tree invasion (Dublin 1995; Sinclair 1995). This makes the outcome of the tree–grass interaction in grazed tropical systems at intermediate rainfall in the presence of fire highly unpredictable (Bond 2005), but very diverse in large herbivores (Olff et al. 2002). Quantitative interaction weights were not available for the interaction web shown in (b). Numbers inside each box indicate the trophic functional group (figure 2). See figure 1 for the interpretation of the different types of arrow.
Figure 7
Figure 7
The positioning of various ecosystems in the phase space formed by the temporal scale of the consumer–resource interactions that structure them, and the temporal scale of the interactions between species and abiotic (non-resource) conditions. Along the x-axis, the growth rate of organisms decreases, while their body size and resource turnover times decrease. Along the y-axis, the rate of change of abiotic (non-resource) conditions decreases, such as microclimate, soil texture, physical structures created by organism (reefs and soil caliche layers) and mixing rate of the medium (water and soil).
Figure 8
Figure 8
The role of pathogens in ecological networks, using the various interaction types outlined in figure 1. Shown is an example where a pathogen attacks a herbivore. Pathogens are successful not only because they use resources provided by hosts, but also especially because they profit from the internal, often homeostatic non-resource conditions (such as temperature, pH) that the host creates within its own body. Therefore, small, exothermic organisms such as bacteria and helminth worms can achieve high populations in situations where they otherwise would be regulated by external (e.g. climatic) forcing; they become uncoupled from those. In addition to receiving favourable conditions and resources from the host, the pathogen can impose direct non-trophic negative (e.g. toxic) effects on the host while the host tries to do the same to the pathogen (e.g. attack it through its immune system). The balance between these rewards and repercussions will determine the success of the pathogen, and the indirect consequences for the host for its interactions with its resources and predators. See figure 1 for the interpretation of the different types of arrow.

Similar articles

Cited by

References

    1. Aerts R. The freezer defrosting: global warming and litter decomposition rates in cold biomes. J. Ecol. 2006;94:713–724. doi:10.1111/j.1365-2745.2006.01142.x - DOI
    1. Allen T.F.H., Starr T.B. Chicago University Press; Chicago, IL: 1982. Hierarchy.
    1. Allesina S., Alonso D., Pascual M. A general model for food web structure. Science. 2008;320:658–661. doi:10.1126/science.1156269 - DOI - PubMed
    1. Alonso D., Etienne R.S., McKane A.J. The merits of neutral theory. Trends Ecol. Evol. 2006;21:451–457. doi:10.1016/j.tree.2006.03.019 - DOI - PubMed
    1. Andersson J.H., Wijsman J.W.M., Herman P.M.J., Middelburg J.J., Soetaert K., Heip C. Respiration patterns in the deep ocean. Geophys. Res. Lett. 2004;31:L03304. doi:10.1029/2003GL018756 - DOI

LinkOut - more resources