Review
. 2009 Jun 27;364(1524):1789-801.
doi: 10.1098/rstb.2008.0273.

The more food webs change, the more they stay the same

Affiliations
Review

The more food webs change, the more they stay the same

Kevin Shear McCann et al. Philos Trans R Soc Lond B Biol Sci. .

Abstract

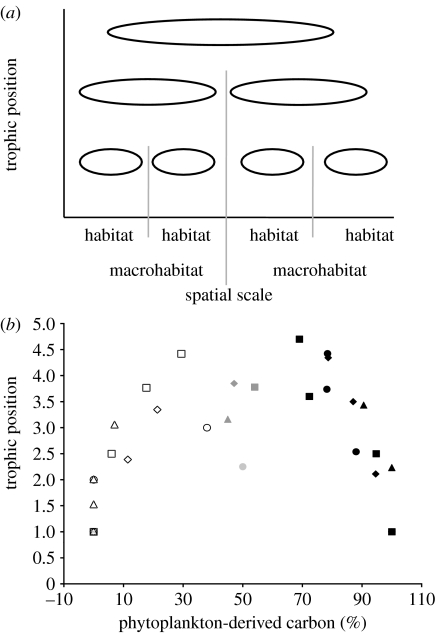
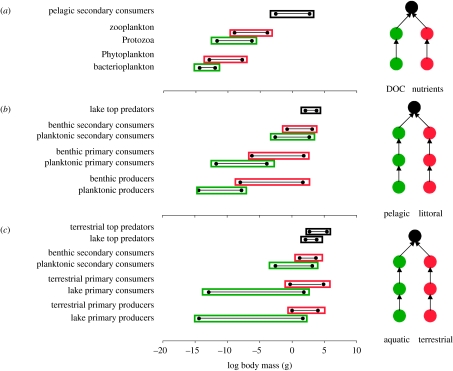
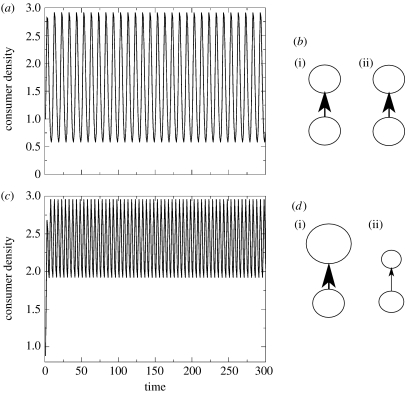
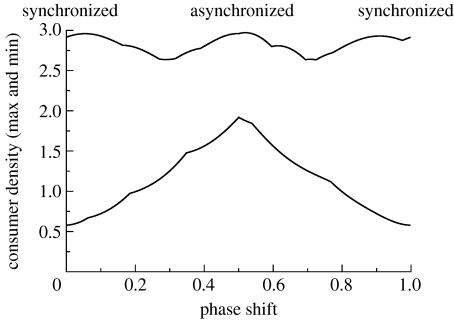
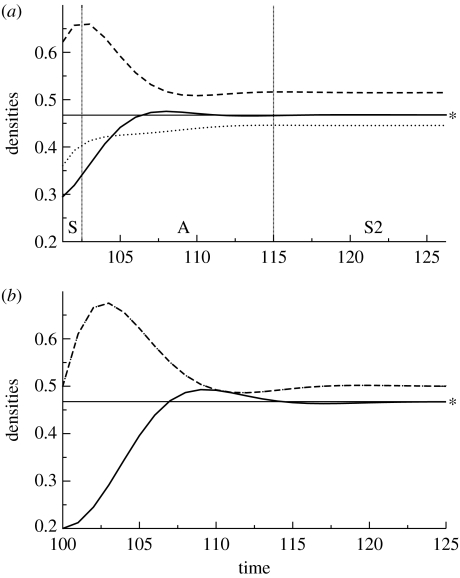
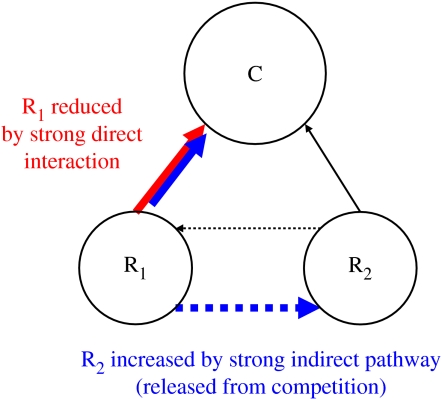
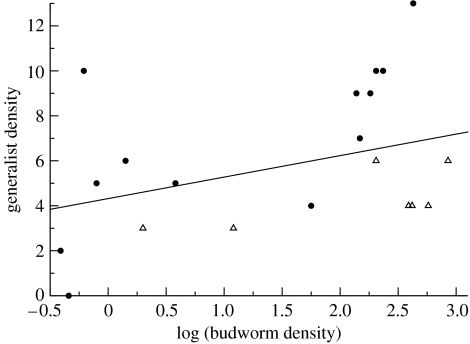
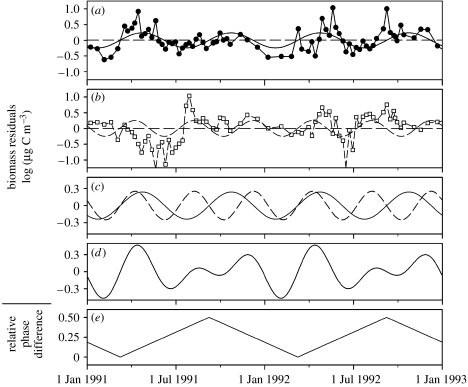
Here, we synthesize a number of recent empirical and theoretical papers to argue that food-web dynamics are characterized by high amounts of spatial and temporal variability and that organisms respond predictably, via behaviour, to these changing conditions. Such behavioural responses on the landscape drive a highly adaptive food-web structure in space and time. Empirical evidence suggests that underlying attributes of food webs are potentially scale-invariant such that food webs are characterized by hump-shaped trophic structures with fast and slow pathways that repeat at different resolutions within the food web. We place these empirical patterns within the context of recent food-web theory to show that adaptable food-web structure confers stability to an assemblage of interacting organisms in a variable world. Finally, we show that recent food-web analyses agree with two of the major predictions of this theory. We argue that the next major frontier in food-web theory and applied food-web ecology must consider the influence of variability on food-web structure.


Figures

Figure 1
Figure 1
(a) The simple architecture of food webs predicted by empirical body-size relationships and foraging theory. Sub-food webs (effectively habitats) are hierarchically coupled by consumers such that, at the highest trophic level, consumers couple regional habitats or macrohabitats. (b) Four well-resolved aquatic webs, which display the predicted hump-shaped architecture over the macrohabitat scale (i.e. relative amount of carbon from pelagic versus benthic). Each symbol represents mean trophic position and carbon content from each trophic guild: white circles, Chile detrital channel; white squares, Cantabrian detrital channel; white triangles, Chesapeake phytoplankton channel; white diamonds, Bering detrital channel; black circles, Chile phytoplankton channel; black squares, Cantabrian phytoplankton channel; black triangles, Chesapeake detrital channel; black diamonds, Bering phytoplankton channel; grey circles, Chile couplers; grey squares, Cantabrian couplers; grey triangles, Chesapeake couplers; grey diamonds, Bering couplers.
Figure 2
Figure 2
The hump-shaped structure of food webs occurs at a variety of scales from (a) within the pelagic, (b) within a lake and (c) between lakes and terrestrial ecosystems. Green and red delineate energy channels and the size range of the resident species. Note that in all cases, there appears to be consistent size differences between pathways such that one pathway is consistently smaller at all trophic levels until the top of the hump-shaped trophic structure whereby both pathways are coupled by predators. Adapted from Rooney et al. (2008). DOC, dissolved organic carbon.
Figure 3
Figure 3
(a) Completely synchronous resources have wildly fluctuating consumer densities. (b) The completely synchronous CR interactions with flux rates (arrows) in space at a given time when R's are relatively high ((i) patch 1 and (ii) patch 2). Interactions are symmetric in space such that there are equal numbers of consumers and resources as well as identical consumption rates in both patches. (c) Completely asynchronous resource dynamics result in much more bounded consumer fluctuations. (d) Consumer resource interaction in each patch at a given time (relatively high resource densities in (i) patch 1). Interactions are asymmetric in space such that (i) patch 1 is a two-trophic-level system and (ii) patch 2 more closely resembles a one-trophic-level system. Parameters: a=1.0; e=1.0; m=0.50; and ω=0.5.
Figure 4
Figure 4
Consumer density, maxima and minima, after a transient of 200 time units as a function of the phase shift (period) between the two resources. Resources are completely synchronized at 0 and 1 full period, and completely asynchronized at a 0.5 period phase shift. The greatest stability occurs with the greatest asynchrony. Parameters: a=1.0; e=1.0; m=0.50; and ω=0.5.
Figure 5
Figure 5
The densities of a consumer (solid lines) and two resources (R1 (dashed lines) and R2 (dotted lines)) plotted after a perturbation at time 100. The horizontal line indicates the new equilibrium consumer density (asterisk). (a) Asymmetric energy flux through two resources results in weak–strong interaction pathways (parameters: r=1.0; K=1.0; a1=2.50; a2=1.50; α12=0.10; α21=1.1; e=1.0; m=0.50; and ω=0.5). Post-perturbation dynamics starts with resources characterized by synchronous dynamics (region S) followed by asynchronous dynamics (region A) and then back to synchronous but stable dynamics (S2). (b) Symmetric flux through two resources results in the two resources being synchronized throughout the post-perturbation period (r=1.0; K=1.0; a1=2.0; a2=2.0; α12=0.60; α21=0.6; e=1.0; m=0.50; and ω=0.5). Note that the greatest stability (quickest return time) occurs with (a) the asynchrony case as indicated by the consumer density approaching equilibrium faster. Note also that in (b) the completely synchronous case, the consumer, C, overshoots the new equilibrium (asterisk) to a greater extent than in (a) the asynchronous case.
Figure 6
Figure 6
Weak and strong pathways within the simple diamond food-web module. Increased consumers have a strong influence on edible resources (red pathway). This, in turn, drives a strong indirect pathway that releases less edible resources from competition (blue pathway). This differential response requires the appropriate trade-offs such that the more edible resource is also the better competitor.
Figure 7
Figure 7
The balsam fir food webs response to changing budworm densities. The number of secondary and tertiary generalist parasitoids increase with increasing budworm density. Thus, as with a bird feeder effect, a cascade of higher order parasitoids appear at high budworm densities. Note that the open triangles (homogenized balsam fir plot) tend to lie below the filled circles (heterogeneous stands).
Figure 8
Figure 8
Asynchrony generation. Using statistical techniques to decompose time series into underlying periodicities, Vasseur et al. (2005) continuously estimated phase shift in edible and less edible phytoplankton (0 is in phase or synchronous and 0.5 is out of phase or asynchronous). The plankton tend to respond by asynchronizing during the summer after a strong synchronizing event in spring. (a) Edible plankton dynamics; (b) less edible plankton; (c) dominant periodicities of edible and less edible trajectories plotted together; (d) summed dynamics; and (e) estimated phase difference. Adapted from Vasseur et al. (2005).

Similar articles

Cited by

References

    1. Bascompte J., Jordano P. Plant–animal mutualistic networks: the architecture of biodiversity. Annu. Rev. Ecol. Evol. Syst. 2007;38:567–593. doi:10.1146/annurev.ecolsys.38.091206.095818 - DOI
    1. Brown J., Gillooly J.F., Allen P., Savage V.M., West G.B. Towards a metabolic theory of ecology. Ecology. 2004;85:1771–1789. doi:10.1890/03-9000 - DOI
    1. Carnicer J., Abrams P.A., Jordano P. Switching behavior, coexistence and diversification: comparing empirical community-wide evidence with theoretical predictions. Ecol. Letts. 2008;11:802–808. doi:10.1111/j.1461-0248.2008.01195.x - DOI - PubMed
    1. Cebrian J. Role of first-order consumers in ecosystem carbon flow. Ecol. Lett. 2004;7:232–240. doi:10.1111/j.1461-0248.2004.00574.x - DOI
    1. Cebrian J., Latrigure J. Patterns of herbivory and decomposition in aquatic and terrestrial ecosystems. Ecol. Monogr. 2004;74:237–259. doi:10.1890/03-4019 - DOI

Publication types

LinkOut - more resources