. 2009 Jul;37(12):e85.
doi: 10.1093/nar/gkp381. Epub 2009 May 18.

Identification of candidate regulatory SNPs by combination of transcription-factor-binding site prediction, SNP genotyping and haploChIP

Affiliations

Identification of candidate regulatory SNPs by combination of transcription-factor-binding site prediction, SNP genotyping and haploChIP

Adam Ameur et al. Nucleic Acids Res. 2009 Jul.

Abstract

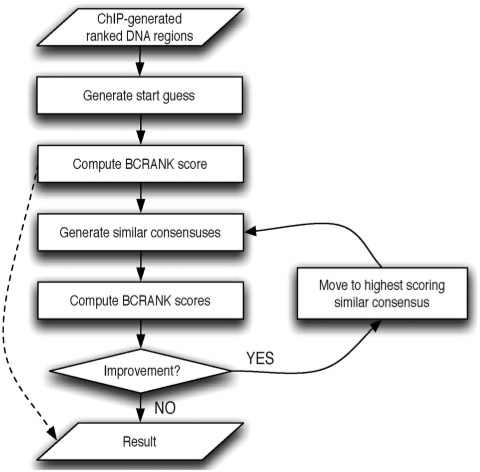
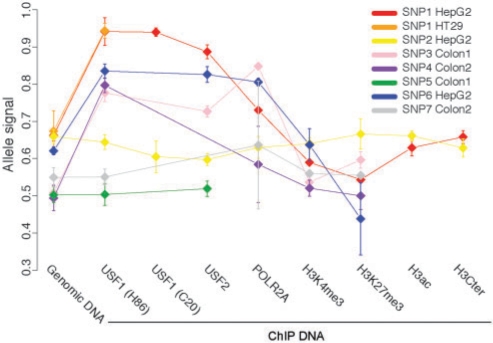
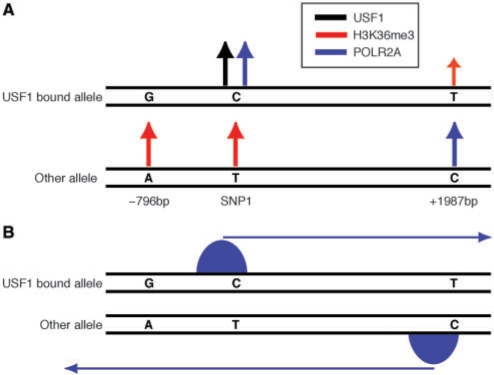
Disease-associated SNPs detected in large-scale association studies are frequently located in non-coding genomic regions, suggesting that they may be involved in transcriptional regulation. Here we describe a new strategy for detecting regulatory SNPs (rSNPs), by combining computational and experimental approaches. Whole genome ChIP-chip data for USF1 was analyzed using a novel motif finding algorithm called BCRANK. 1754 binding sites were identified and 140 candidate rSNPs were found in the predicted sites. For validating their regulatory function, seven SNPs found to be heterozygous in at least one of four human cell samples were investigated by ChIP and sequence analysis (haploChIP). In four of five cases where the SNP was predicted to affect binding, USF1 was preferentially bound to the allele containing the consensus motif. Allelic differences in binding for other proteins and histone marks further reinforced the SNPs regulatory potential. Moreover, for one of these SNPs, H3K36me3 and POLR2A levels at neighboring heterozygous SNPs indicated effects on transcription. Our strategy, which is entirely based on in vivo data for both the prediction and validation steps, can identify individual binding sites at base pair resolution and predict rSNPs. Overall, this approach can help to pinpoint the causative SNPs in complex disorders where the associated haplotypes are located in regulatory regions.

Availability: BCRANK is available from Bioconductor (http://www.bioconductor.org/).


Figures

Figure 1.
Figure 1.
Overview of the BCRANK algorithm. A file containing DNA sequences, ranked by ChIP-enrichment, is given as input. Then a consensus sequence is generated, either at random or by manual selection, and its BCRANK score is computed. Optionally, BCRANK can be used to assign scores to previously known consensus sequences, and in such case the algorithm stops here, indicated by dotted line in the figure. Otherwise the algorithm will continue to optimize the consensus by constantly moving to a similar consensus with a higher BCRANK score until no further improvement is possible and a locally optimal solution is reported. The chance of finding the globally optimal solution can be increased by re-starting BCRANK several times with different random start guesses.
Figure 2.
Figure 2.
Summary of the seven heterozygous SNPs. Each SNP is represented by a distinct color. SNP1 was the only one to be heterozygous in two samples (HepG2 and HT29) and it is therefore represented by two colors. Each point in the plot shows the average allele signal over all replicates in a given sample, for all proteins analyzed by ChIP. The interquartile range is displayed by error bars.
Figure 3.
Figure 3.
Sequencing results for SNP1 (rs1867760), which is in the sequence AA[T/C]ACGTGACCC. (A) Sequencing of SNP1 in various samples extracted from HepG2 cells. The SNP is heterozygous in HepG2 genomic DNA since both the C-allele (blue) and T-allele (red) show a peak at the third position (see top row). In USF1 and USF2 ChIP DNA the C-allele gives much higher signal than the T-allele. (B) Standard box-and-whisker plots showing the allele signals for SNP1 in HepG2 and HT29. Above each box are P-values from a t-test, indicating whether the allele signal in ChIP DNA is significantly different from the allele signal in genomic DNA. High allele signals are obtained for samples with higher C-allele peaks when compared to the corresponding T-allele peaks. See ‘Methods’ section for descriptions of allele signals and statistical testing. (C) Quantification of sequencing results for two SNPs at −91 (red boxes) and +1987 (blue boxes) bases from SNP1, respectively. The orange lines indicate the average allele signal for SNP1 in each sample.
Figure 4.
Figure 4.
Sequencing results for SNP3 (rs16875109), which is in the sequence CTCA[T/C]GTGACCT. Standard box-and-whisker plots showing quantification results for SNP3 in the Colon1 sample. At the top of each box are P-values from a t-test, indicating whether the allele signal in ChIP DNA is significantly different from that in genomic DNA. High allele signals are obtained for samples with higher C-allele peaks when compared to the corresponding T-allele peaks. See ‘Methods’ section for descriptions of allele signals and statistical testing.
Figure 5.
Figure 5.
Transcription organization in a region surrounding SNP1. (A) Summary of sequencing results for SNP1-796, SNP1 and SNP1 + 1987. The two alleles are shown separately. The arrows indicate positions with differential allelic enrichment of USF1, H3K36me3 and POLR2A and are placed above the allele showing higher enrichment. Differential enrichment of H3K36me3 was not significant for SNP1 + 1987 bp and is therefore indicated by smaller arrow. (B) A model explaining the transcription organization in the region. The blue peaks indicate positions with high POLR2A. The arrows show the direction of transcription.

References

    1. Frazer KA, Ballinger DG, Cox DR, Hinds DA, Stuve LL, Gibbs RA, Belmont JW, Boudreau A, Hardenbol P, Leal SM, et al. A second generation human haplotype map of over 3.1 million SNPs. Nature. 2007;449:851–861. - PMC - PubMed
    1. Morley M, Molony CM, Weber TM, Devlin JL, Ewens KG, Spielman RS, Cheung VG. Genetic analysis of genome-wide variation in human gene expression. Nature. 2004;430:743–747. - PMC - PubMed
    1. Spielman RS, Bastone LA, Burdick JT, Morley M, Ewens WJ, Cheung VG. Common genetic variants account for differences in gene expression among ethnic groups. Nat. Genet. 2007;39:226–231. - PMC - PubMed
    1. Dixon AL, Liang L, Moffatt MF, Chen W, Heath S, Wong KC, Taylor J, Burnett E, Gut I, Farrall M, et al. A genome-wide association study of global gene expression. Nat. Genet. 2007;39:1202–1207. - PubMed
    1. Goring HH, Curran JE, Johnson MP, Dyer TD, Charlesworth J, Cole SA, Jowett JB, Abraham LJ, Rainwater DL, Comuzzie AG, et al. Discovery of expression QTLs using large-scale transcriptional profiling in human lymphocytes. Nat. Genet. 2007;39:1208–1216. - PubMed

Publication types

Substances