. 2009 Jun 8;206(6):1327-37.
doi: 10.1084/jem.20082173. Epub 2009 May 18.

Activated monocytes in peritumoral stroma of hepatocellular carcinoma foster immune privilege and disease progression through PD-L1

Affiliations

Activated monocytes in peritumoral stroma of hepatocellular carcinoma foster immune privilege and disease progression through PD-L1

Dong-Ming Kuang et al. J Exp Med. .

Abstract

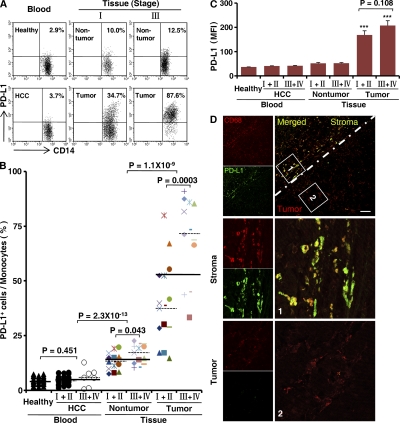
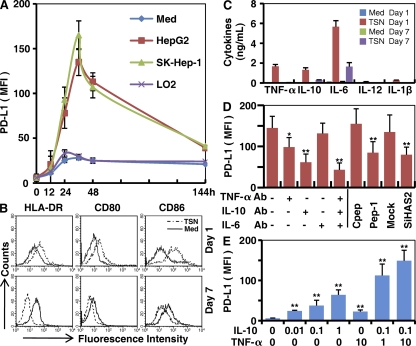
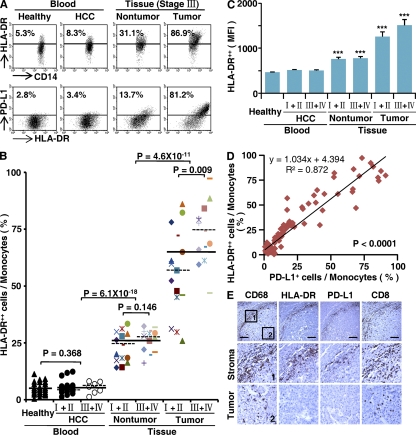
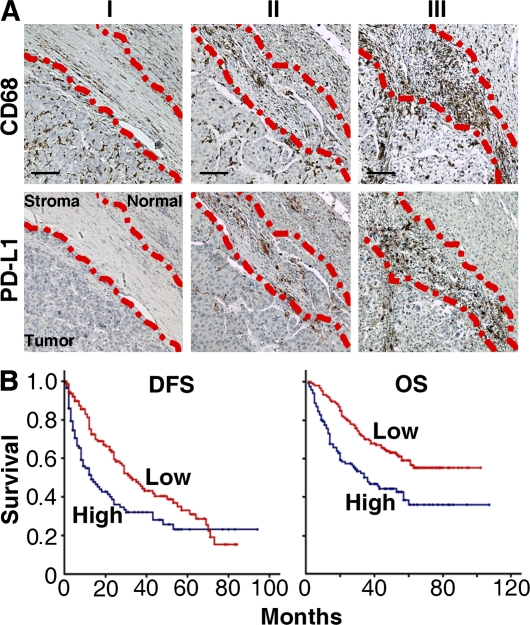
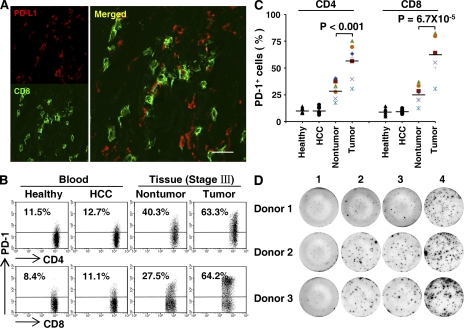
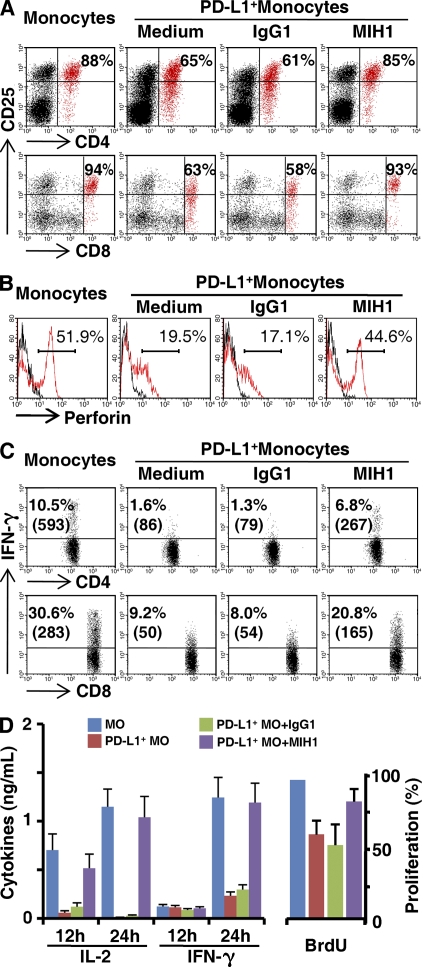
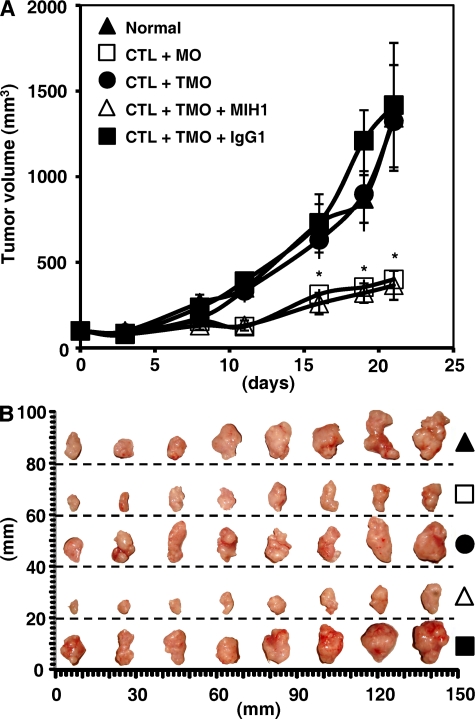
Macrophages (Mphi) are prominent components of solid tumors and exhibit distinct phenotypes in different microenvironments. We have recently found that tumors can alter the normal developmental process of Mphi to trigger transient activation of monocytes in peritumoral stroma. We showed that a fraction of monocytes/Mphi in peritumoral stroma, but not in cancer nests, expresses surface PD-L1 (also termed B7-H1) molecules in tumors from patients with hepatocellular carcinoma (HCC). Monocytes activated by tumors strongly express PD-L1 proteins with kinetics similar to their activation status, and significant correlations were found between the levels of PD-L1(+) and HLA-DR(high) on tumor-infiltrating monocytes. Autocrine tumor necrosis factor alpha and interleukin 10 released from activated monocytes stimulated monocyte expression of PD-L1. The PD-L1(+) monocytes effectively suppressed tumor-specific T cell immunity and contributed to the growth of human tumors in vivo; the effect could be reversed by blocking PD-L1 on those monocytes. Moreover, we found that PD-L1 expression on tumor-infiltrating monocytes increased with disease progression, and the intensity of the protein was associated with high mortality and reduced survival in the HCC patients. Thus, expression of PD-L1 on activated monocytes/Mphi may represent a novel mechanism that links the proinflammatory response to immune tolerance in the tumor milieu.


Figures

Figure 1.
Figure 1.
Monocytes isolated from human HCC tumor tissue expressed PD-L1. (A–C) FACS analysis of PD-L1 expression on fresh monocytes isolated from peripheral blood and tissues. The percentage of PD-L1+CD14high monocytes (A and B) and the mean fluorescence intensity (MFI) of PD-L1+CD14high cells (C) are shown. The numbers of samples collected from patients and donors in A–C were as follows: blood from 28 healthy individuals, and 21 stage I and II and 7 stage III and IV HCC patients; and paired nontumor and tumor tissue from 15 stage I and II and 13 stage III and IV HCC patients. The data shown in A are representative dot plots of at least seven individuals from more than five independent experiments; B and C show the statistical analysis of these samples. The continuous and dashed horizontal bars in B represent median values. Results are expressed as means ± SEM. (D) Analysis of PD-L1 distribution in HCC samples by confocal microscopy. The micrographs at higher magnification show the stained peritumoral stroma region (1) and a cancer nest (2). Significant difference compared with healthy blood is indicated (***, P < 0.0001). 1 out of 10 representative micrographs is shown in D. Bar, 50 µm.
Figure 2.
Figure 2.
Tumor environments regulated PD-L1 expression on monocytes/Mφ. (A) Monocytes were left untreated or cultured with the indicated supernatants for different times. (B and C) Monocytes were left untreated or cultured with supernatant from SK-Hep-1 cells (TSN) for the indicated times. (D) Monocytes were left untreated or pretreated for 1 h with the indicated blocking antibodies, Pep-1, or control peptide (Cpep), and were then incubated for 24 h with SK-Hep-1 TSN. In parallel, some untreated monocytes were incubated for 24 h with TSNs from mock or SiHAS2 cells. (E) Monocytes were incubated for 24 h with rhIL-10 or rhTNF-α at the indicated concentrations (ng/ml). The MFI of PD-L1 and expression of surface markers were determined by FACS, and the production of cytokines was assessed by ELISA. The histograms in B are representative of five separate experiments. Values given in A, C, D, and E represent the means ± SE of four separate experiments. *, P < 0.05; and **, P < 0.01 indicate a significant difference from untreated TSN-exposed monocytes (D) or untreated monocytes (E).
Figure 3.
Figure 3.
Expression pattern of PD-L1 was correlated with the activation pattern of monocytes/Mφ in peritumoral stroma. (A–C) FACS analysis of PD-L1 and HLA-DR expression in fresh monocytes isolated from peripheral blood and tissues. Representative data on PD-L1+HLA-DRhigh monocytes (A), percentages of HLA-DRhighCD14high monocytes (B), and the MFI of HLA-DR in HLA-DRhighCD14high monocytes (C) are shown. The samples collected and the numbers of donors in A–C were the same as in Fig. 1. The data shown in A are representative dot plots of at least seven individuals from more than five independent experiments; B and C show the statistics analysis of these samples. The continuous and dashed horizontal bars in B represent median values. Results are expressed as means ± SEM. (D) Positive correlations between the levels of PD-L1+ and HLA-DRhigh monocytes. The samples used in D were blood from healthy individuals, HCC patients, and paired nontumor and tumor tissues from HCC patients (n = 28 for each). (E) Adjacent sections of paraffin-embedded hepatoma samples stained with the indicated markers. The micrographs at higher magnification show the peritumoral stroma region (1) and a cancer nest (2). Significant difference compared with healthy blood is indicated (***, P < 0.0001). 1 out of 15 representative micrographs is shown in E. Bars, 150 µm.
Figure 4.
Figure 4.
Accumulation of PD-L1+CD68+ cells in peritumoral stroma predicted poor survival in HCC patients. (A) Adjacent sections of paraffin-embedded hepatoma samples stained with an anti-CD68 or an anti–PD-L1 antibody. Different levels of Mφ infiltration can be seen along the peritumoral region: I, none or slight; II, moderate; and III, strong. The dashed lines represent the edges of tumor, stroma, or normal tissues. Bars, 50 µm. (B) OS and DFS in 262 HCC patients in relation to CD68 density in peritumoral stroma. The patients were divided into two groups according to the median value of CD68+ Mφ density in peritumoral stroma: red lines, low density (n = 134); blue lines, high density (n = 128). Cumulative OS and DFS time were calculated by the Kaplan-Meier method and analyzed by the log-rank test.
Figure 5.
Figure 5.
Tumor-derived monocytes induced T cell suppression via PD-L1. (A) Physical contact between PD-L1+ cells (red) and CD8+ cytotoxic T cells (green) in HCC peritumoral stroma. One out of five representative micrographs is shown in A. Bar, 20 µm. (B and C) Increased expression of PD-1 protein on the surface of tumor-infiltrating T cells from HCC patients. The samples used in B and C were fresh blood from healthy individuals and HCC patients, and paired nontumor and tumor tissues from HCC patients (n = 7 for each). The data shown in B are representative dot plots of seven patients from six independent experiments. The horizontal bars in C represent median values. (D) HCC-derived monocytes induced anergy of tumor T cells with reduced IFN-γ production. Purified tumor T cells were left untreated (1), or were incubated for 20 h with autologous tumor monocytes supplemented with 25 µg/ml of autologous tumor mass lysate in the absence (2) or presence of 5 µg/ml of control (3) or anti–PD-L1 antibody (4). Thereafter, production of IFN-γ was determined by ELISPOT. Three out of six representative patient samples are shown in D.
Figure 6.
Figure 6.
TSN-exposed monocytes induced T cell suppression via PD-L1. Autologous monocytes (MO) or TSN-treated monocytes (PD-L1+ MO) were pretreated with 10 µg/ml mitomycin C for 30 min and were then washed and incubated with tumor-specific T cells (1:10) in the presence or absence of 5 µg/ml anti–PD-L1 or control antibody, as described in Materials and methods. The expression of CD25 on (A) T cells, (B) perforin in CD8+ T cells, and (C) intracellular staining of IFN-γ were determined by FACS, and (D) the secretion of cytokines and proliferation of T cells were determined by ELISA and BrdU assay, respectively. The results shown are representative of at least four separate experiments and are expressed as means ± SEM. Significant differences compared with normal monocytes are indicated (*, P < 0.05; and **, P < 0.01).
Figure 7.
Figure 7.
Blockade of PD-L1 improved monocyte-mediated T cell activation in vivo. (A) Blocking PD-L1 in TSN-conditioned monocytes results in tumor regression in vivo. Mice were injected with human HepG2 cells, as described in Materials and methods. The control animals (▴) received no further injections. The experimental treatments entailed injections with tumor-specific T cells in combination with untreated monocytes (□) or TSN-exposed monocytes (•), or TSN-exposed monocytes pretreated with an anti–PD-L1 antibody (▵) or a control antibody (▪). The illustrated data represent means ± SD of tumor volumes (n = 8 tumors in each group of four mice). The day of T cell injection was counted as day 0. The results shown in A are representative of three separate experiments and are expressed as means ± SEM. *, P < 0.05 compared with control antibody. CTL, tumor-specific T cells; MO, monocytes; TMO, TSN-exposed monocytes. (B) The tumors were excised and photographed 21 d after injecting the cells. One out of three separate experiments is shown in B.

References

    1. Mueller M.M., Fusenig N.E. 2004. Friends or foes - bipolar effects of the tumor stroma in cancer.Nat. Rev. Cancer. 4:839–849 - PubMed
    1. Tlsty T.D., Coussens L.M. 2006. Tumor stroma and regulation of cancer development.Annu. Rev. Pathol. 1:119–150 - PubMed
    1. Ahmed F., Steele J.C., Herbert J.M., Steven N.M., Bicknell R. 2008. Tumor stroma as a target in cancer.Curr. Cancer Drug Targets. 8:447–453 - PubMed
    1. Zou W., Chen L. 2008. Inhibitory B7-family molecules in the tumor microenvironment.Nat. Rev. Immunol. 8:467–477 - PubMed
    1. Budhu A., Forgues M., Ye Q.H., Jia H.L., He P., Zanetti K.A., Kammula U.S., Chen Y., Qin L.X., Tang Z.Y., Wang X.W. 2006. Prediction of venous metastases, recurrence, and prognosis in hepatocellular carcinoma based on a unique immune response signature of the liver microenvironment.Cancer Cell. 10:99–111 - PubMed

Publication types

MeSH terms