. 2009 Aug;19(8):1480-96.
doi: 10.1101/gr.088260.108. Epub 2009 May 18.

Incorporating nucleosomes into thermodynamic models of transcription regulation

Affiliations

Incorporating nucleosomes into thermodynamic models of transcription regulation

Tali Raveh-Sadka et al. Genome Res. 2009 Aug.

Abstract

Transcriptional control is central to many cellular processes, and, consequently, much effort has been devoted to understanding its underlying mechanisms. The organization of nucleosomes along promoter regions is important for this process, since most transcription factors cannot bind nucleosomal sequences and thus compete with nucleosomes for DNA access. This competition is governed by the relative concentrations of nucleosomes and transcription factors and by their respective sequence binding preferences. However, despite its importance, a mechanistic understanding of the quantitative effects that the competition between nucleosomes and factors has on transcription is still missing. Here we use a thermodynamic framework based on fundamental principles of statistical mechanics to explore theoretically the effect that different nucleosome organizations along promoters have on the activation dynamics of promoters in response to varying concentrations of the regulating factors. We show that even simple landscapes of nucleosome organization reproduce experimental results regarding the effect of nucleosomes as general repressors and as generators of obligate binding cooperativity between factors. Our modeling framework also allows us to characterize the effects that various sequence elements of promoters have on the induction threshold and on the shape of the promoter activation curves. Finally, we show that using only sequence preferences for nucleosomes and transcription factors, our model can also predict expression behavior of real promoter sequences, thereby underscoring the importance of the interplay between nucleosomes and factors in determining expression kinetics.


Figures

Figure 1.
Figure 1.
Illustration of our thermodynamic framework. Each promoter sequence encodes particular binding affinity landscapes for both transcription factors and nucleosomes. Given these landscapes as input as well as the concentrations of transcription factors and nucleosomes, our framework can then compute the distribution over all possible configurations of molecules bound to the promoter (see “Modeling Framework”). Applying these computations to different promoters (represented by different affinity landscapes) and over a range of transcription factor concentrations thus allows us to compute the activation curve of various promoters as a function of transcription factor concentrations. (A) Here we examine three promoters (discussed in detail in the Results section): (1) A nucleosome-free promoter, represented by a binding affinity landscape for nucleosomes that is zero at every promoter location. Shown are the two possible configurations (bound/unbound) with their respective statistical weights. (2) A promoter with a uniform binding affinity landscape for nucleosomes. Shown is a subset of the possible binding configurations, each with its respective statistical weight. (3) A promoter with a boundary element for nucleosome formation—resulting in a trough in the otherwise uniform landscape for nucleosomes. The transcription factor binding site is located 10 bp from the boundary element. A subset of the possible configurations is shown. Note that in all configurations the boundary element cannot be occluded by a nucleosome. (B) Promoter activation curves showing the probability of transcription factor binding at the site, Pbound, at various transcription factor concentrations (log scale, arbitrary units), for the three promoters in A. The activation curves of these promoters are identical in shape but shifted (in log scale) relative to one another.
Figure 2.
Figure 2.
Predicted and observed activation curves for the PHO5 promoter variants. (A) The PHO5 promoter variants constructed by Lam et al. (2008), in which wild-type Pho4p sites were engineered to create various combinations of high- and low-affinity sites for the transcription factor, which were either exposed or covered by the −2 and −3 nucleosomes. For each variant, shown is a schematic representation of its binding affinity landscapes for transcription factors and nucleosomes. We excluded variants L2 and H2 since they are identical (because of symmetry) under our model to variants wild type and H3, respectively. (B) Experimental measurements by Lam et al. (2008) of the expression curves (scaled to maximum expression) of each variant following Pi starvation. [Reprinted with permission from Macmillan Publishers Ltd. © 2008, Lam et al. 2008.] (C) Prediction of the binding probability of Pho4p, Pbound, generated by applying our thermodynamic framework to each of the promoter variants from A at increasing Pho4p concentrations. In B and C, the yellow inset indicates the relative ordering of the onset times of the promoter variants with exposed low-affinity sites, where in both cases L3 is activated first, followed by wild type, L4, and L1. The energetic contribution (formula image) from transcription factor binding is set to 860 for a strong site, and 200 for a weak site, in accordance with the 4.3 ratio between strong and weak Pho4p sites reported in Lam et al. (2008).
Figure 3.
Figure 3.
Addition of a boundary element for nucleosome formation to a simple promoter. (A) The periodic pattern of nucleosome occupancy induced by perfect boundaries for nucleosome formation (dark purple), as predicted by our thermodynamic model. Perfect boundaries are assumed to never be occluded by nucleosomes. Shown is the nucleosome formation probability at each base pair, Pcovered, as a function of the distance from the boundary. The same probability is computed for a sequence with no boundaries (pink). (B) Probabilities for transcription factor binding and nucleosome formation as a function of the distance from a boundary element. Shown is the probability of a transcription factor site to be bound, Pbound (red), and the probability of the center base pair within the binding site to be covered by a nucleosome, Pcovered (blue), as a function of the distance d of the site from the boundary, under a fixed transcription factor concentration (see Table 1). For comparison, Pbound and Pcovered values, under the same transcription factor concentration, for a corresponding binding site on a promoter with no boundaries (light green and dark green curves, respectively), are also displayed. (C) Shown are graphs of transcription factor binding probabilities, Pbound, at increasing transcription factor concentrations, for the promoters described in D, in which the transcription factor binding sites are located at different distances from a nucleosome boundary element. (D) Schematic illustrations for the promoters used in C and E and the associated binding affinities for nucleosomes and transcription factors. (E) Shown in color is the nucleosome formation probability at every base pair, Pcovered, for each of the promoters in D. Shown in black is the probability of transcription factor binding, Pbound. For each promoter, we present Pcovered and Pbound values at three concentrations of the corresponding transcription factor, (10−3, 10−1.5, and 100). We also illustrate the probable configuration of transcription factors and nucleosomes on these promoters, for each of the transcription factor concentrations, by employing a threshold (0.6) for both transcription factor binding and nucleosome formation. Note that in promoters (marked as 2 and 5) where the sites are relatively exposed at low transcription factor concentrations (owing to the effect of the boundary), the change in nucleosome occupancy in the base pairs surrounding the sites is less pronounced at higher transcription factor concentrations, compared to promoters (marked as 3 and 4) in which the sites were relatively occluded by nucleosomes at low transcription factor concentrations.
Figure 4.
Figure 4.
Obligate cooperative/destructive effects between transcription factor sites. For two promoters containing two sites for different transcription factors (marked as transcription factors 1 and 2) at different distances (10/135 bp), shown is the probability of binding for transcription factor 1 to its site (left site) for increasing concentrations of both transcription factors (right heat maps). This probability is, in fact, the sum of two probabilities: the probability that only transcription factor 1 is bound to its site while transcription factor 2 is not bound to its site (left heat maps), and the probability that both sites are occupied (middle heat maps). Note that when the sites are located at a distance of 10 bp from each other (top heat maps), a cooperative effect is observed—the binding of one transcription factor positively affects the probability of the other transcription factor to be bound, and thus the most prevalent configuration is one where both sites are occupied, even when the concentration of one of the transcription factors is relatively low. However, when the distance between the sites is 135 (bottom heat maps), a destructive effect is observed. The binding of one transcription factor negatively affects the probability of the other transcription factor to be bound, and thus the configuration where the two sites are occupied is rare and occurs only at extreme concentrations of both factors.
Figure 5.
Figure 5.
Addition of a transcription factor site to a simple promoter and its effect on the Pbound graph. (A) Illustrations of the promoters considered and the associated binding affinities for nucleosomes and transcription factors. (B) Shown are transcription factor binding probabilities to a low-affinity binding site for a simple promoter with a single low-affinity site (green), and for promoters with an additional high-affinity site located at various distances from the low-affinity site at increasing transcription factor concentrations. The addition of a transcription factor binding site can have both a cooperative effect (light purple and pink curves) and a destructive effect (yellow and cyan curves). Note that the addition of a transcription factor site results in a change in the shape of the activation curve. (C) Shown is the ratio between the probability of transcription factor binding to the low affinity site in a promoter with two transcription factor sites (Pbound,2sites) and in a promoter with one transcription factor site (Pbound,1site) at increasing transcription factor concentrations. This ratio can be viewed as the strength of the cooperative/destructive binding effect between the transcription factors (see main text). The ratio obtained changes as concentration increases and can be larger or smaller than one indicating a cooperative/destructive effect, respectively. (D–F) Examination of the cooperative effect generated by adding an adjacent high-affinity site to a promoter with a single, either low- or high-affinity, transcription factor site. (D) Illustrations of the promoters considered and the associated binding affinities for nucleosomes and transcription factors. (E) Transcription factor binding probability graphs for promoters with one high-affinity site (pink curve), two high-affinity sites (red curve), one low-affinity site (light blue), or one low-affinity and one high-affinity site (blue). The energetic contribution (formula image) from binding is set to 1200 for a high-affinity site, and 200 for a low-affinity site. (F) Shown is the ratio between the probability of transcription factor binding to the left site (marked as site 1) in a promoter with two transcription factor sites (Pbound,2sites) and in a promoter with one transcription factor site (Pbound,1site) at increasing transcription factor concentrations. Note that the cooperative effect between a low-affinity site and a high-affinity site is larger than the cooperative effect between two high-affinity sites.
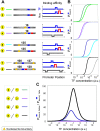
Figure 6.
Figure 6.
Combination of promoter elements produces a diverse range of activation curves. (A) Schematic illustrations for the promoters used in this figure and the associated binding affinities for nucleosomes and transcription factors. (B) Probability of transcription factor binding to a low-affinity site at increasing transcription factor concentrations for promoters with this low-affinity site as a single site (light colors, Pbound,1site) or for promoters with an additional high-affinity site for the same transcription factor (dark colors, Pbound,2sites). The distance between the two binding sites is set to 1 bp. The sites are located on the promoters at varying distances from one or two boundary elements for nucleosome formation. The energetic contribution (formula image) from binding is set to 1200 for a high-affinity site, and 200 for a low-affinity site. (C) The ratio between Pbound,2sites to Pbound,1site from B at increasing transcription factor concentrations. This ratio represents the strength of the cooperative/destructive binding effect between the transcription factors. The ratio obtained is >1, indicating a positive cooperative effect. However, the strength of the effect depends on the locations of the sites relative to the boundary: the ratio is higher for sites that are relatively covered by nucleosomes at low transcription factor concentrations.
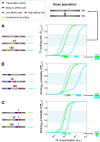
Figure 7.
Figure 7.
Nucleosomes as generators of distinct noise behaviors. Shown is the “noisy” regime of intermediate Pbound values (defined as 0.3–0.7) for the low-affinity (left) site in different promoters. These intermediate Pbound values correspond to a heterogeneous cell population where some cells exhibit one state of transcription factor binding, and others exhibit a different state. (A) Promoters (from Fig. 3C) with a single transcription factor site and a single boundary element, located at various distances from the site. Note that in all promoters the extent of the range of transcription factor concentrations responsible for “noisy” Pbound values is the same, but its location changes. (B) Promoters (from Fig. 5B) with high- and low-affinity sites for some transcription factor. Sites are located at various distances from each other. Note that both the location and the extent of the range of transcription factor concentrations responsible for “noisy” Pbound values are altered between promoters. When the sites are close together (10 bp), a cooperative effect is formed, and the extent of the range of concentrations responsible for the “noisy” regime is decreased. Conversely, when the sites are 135 bp apart, a destructive effect is observed, and the extent of the range of concentrations responsible for the noisy regime is increased. (C) Promoters (from Fig. 6B) with a high- and a low-affinity site for some transcription factor, located at various distances from a boundary element. The distance between the sites is set to 1 bp. Here, the boundary addition results in a change to both the location and the extent of the range of transcription factor concentrations responsible for “noisy” Pbound values. When the sites are close to the boundary (10 bp), the probability of a nucleosome covering the sites and generating a strong obligate cooperative effect is decreased, and thus the extent of the range of concentrations responsible for the noisy regime is increased. Conversely, when the sites are far from the boundary (135 bp), the probability of a nucleosome covering the sites and generating a strong obligate cooperative effect is increased, and, thus, the extent of the range of concentrations responsible for the noisy regime is decreased.
Figure 8.
Figure 8.
Our model predicts expression behavior of real promoter sequences. (A) Shown are real binding affinity landscapes for each of the PHO5 promoter variants from Lam et al. (2008) (800 bp upstream of the PHO5 gene) (see description in Fig. 2A), generated using the real binding preferences for Pho4p (Lam et al. 2008) and for nucleosomes (Kaplan et al. 2009). For each base pair, the binding affinity landscape displays the likelihood for a bound transcription factor or nucleosome to start at that sequence position. Note that since real sequences are used, unlike in Figure 2, variants L2 and H2 are no longer identical to variants wild type and H3 (respectively), and are therefore included in the analysis. (B) Model prediction of the binding probability of Pho4p, Pbound, generated by applying our thermodynamic framework to each of the promoter variants from A at increasing Pho4p concentrations. The yellow inset indicates the predicted relative ordering of the onset times of the promoter variants with exposed low-affinity sites. Note that here, too, similar to the case when using simplified promoters (Fig. 2), the order predicted is identical to the one measured (see Fig. 2B). (C) Shown is the predicted average nucleosome occupancy (log occupancy divided by the median) at low (10−5) Pho4p concentration for each position along the sequence of the wild-type variant of PHO5. (D) Same as A, but for HIS3 promoter variants constructed by Iyer and Struhl (1995), in which a native 17-bp nonperfect poly(dA:dT) element was either deleted or replaced by a perfect poly(dA:dT) element of length 17, 29, or 42 bp. For each variant, shown are real binding affinity landscapes (intergenic region between the HIS3 gene and the upstream gene MRM1 [also known as PET56]), generated using the real binding preferences for Gcn4p (MacIsaac et al. 2006) and for nucleosomes (Kaplan et al. 2009). (E) Model prediction of the binding probability of Gcn4p, Pbound, generated by applying our thermodynamic framework to each of the promoter variants from D at increasing Gcn4p concentrations. (F) Expression value measurements by Iyer and Struhl (1995) for each of the promoter variants from D.

References

    1. Adams CC, Workman JL. Binding of disparate transcriptional activators to nucleosomal DNA is inherently cooperative. Mol Cell Biol. 1995;15:1405–1421. - PMC - PubMed
    1. Anderson JD, Widom J. Poly(dA-dT) promoter elements increase the equilibrium accessibility of nucleosomal DNA target sites. Mol Cell Biol. 2001;21:3830–3839. - PMC - PubMed
    1. Bernstein BE, Liu CL, Humphrey EL, Perlstein EO, Schreiber SL. Global nucleosome occupancy in yeast. Genome Biol. 2004;5:R62. doi: 10.1186/gb-2004-5-9-r62. - DOI - PMC - PubMed
    1. Bintu L, Buchler NE, Garcia HG, Gerland U, Hwa T, Kondev J, Kuhlman T, Phillips R. Transcriptional regulation by the numbers: Applications. Curr Opin Genet Dev. 2005;15:125–135. - PMC - PubMed
    1. Buchler NE, Gerland U, Hwa T. On schemes of combinatorial transcription logic. Proc Natl Acad Sci. 2003;100:5136–5141. - PMC - PubMed

Publication types

MeSH terms

LinkOut - more resources