. 2009 Jun;11(2):371-80.
doi: 10.1208/s12248-009-9112-5. Epub 2009 May 19.

Handling data below the limit of quantification in mixed effect models

Affiliations

Handling data below the limit of quantification in mixed effect models

Martin Bergstrand et al. AAPS J. 2009 Jun.

Abstract

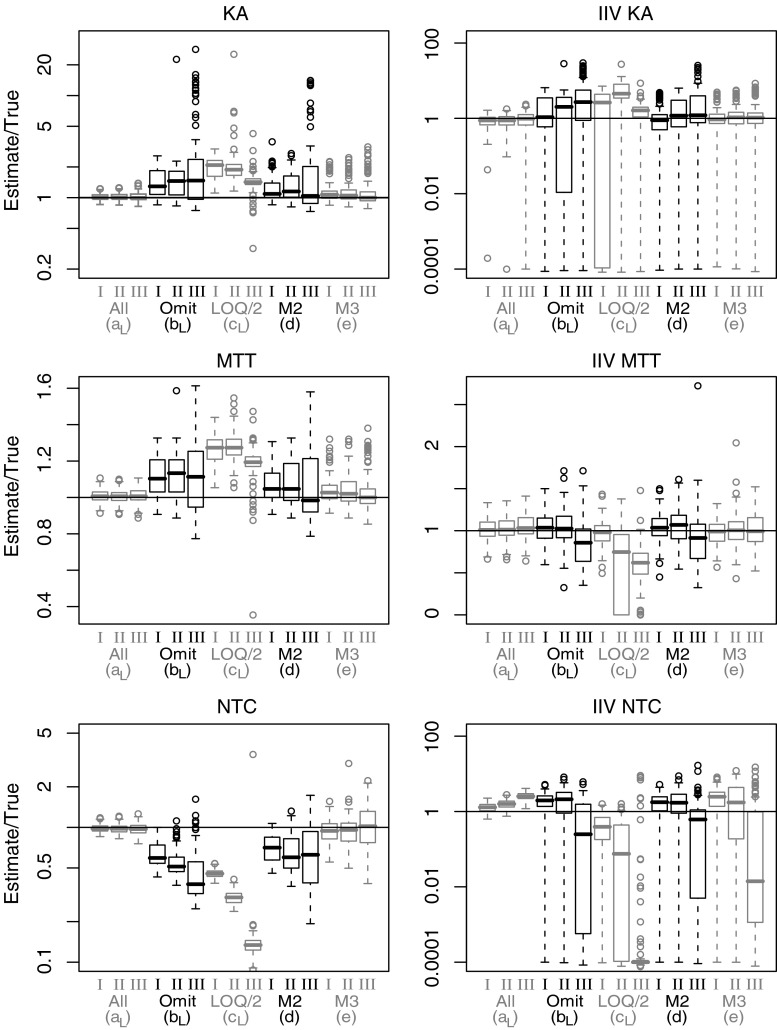
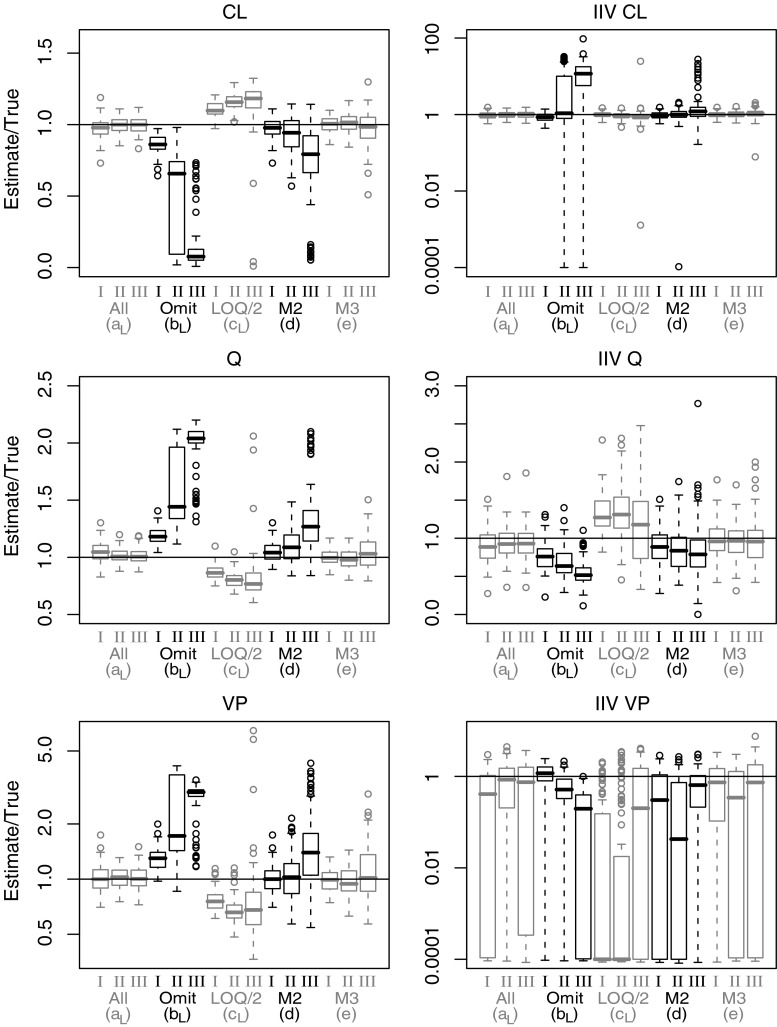
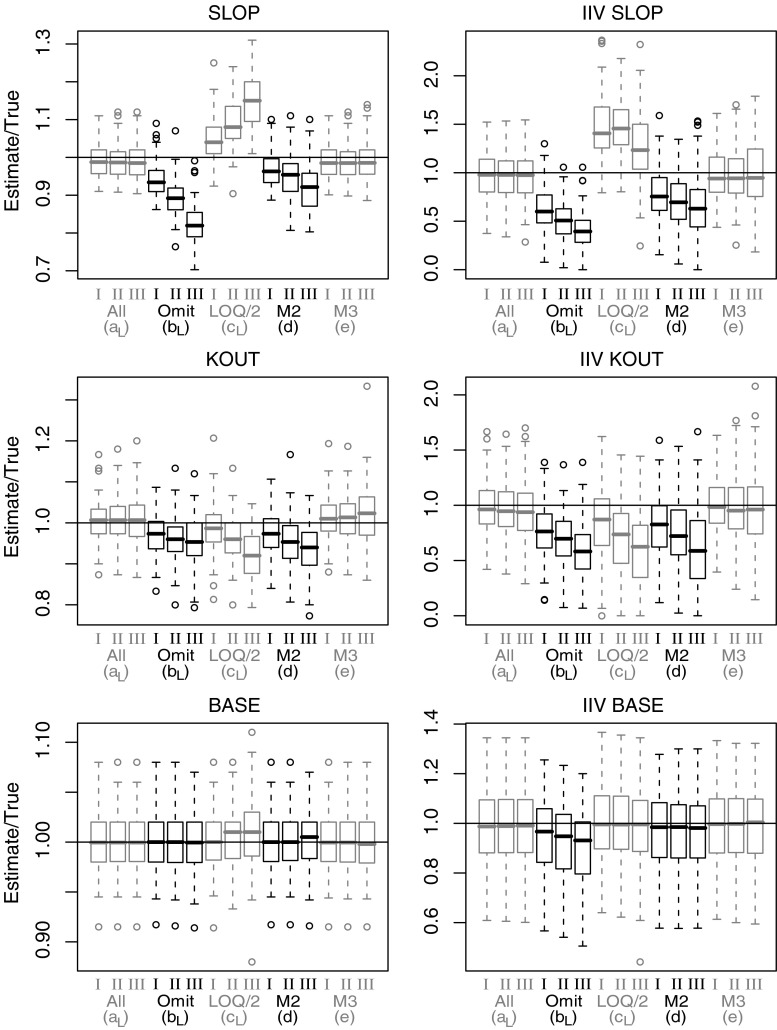
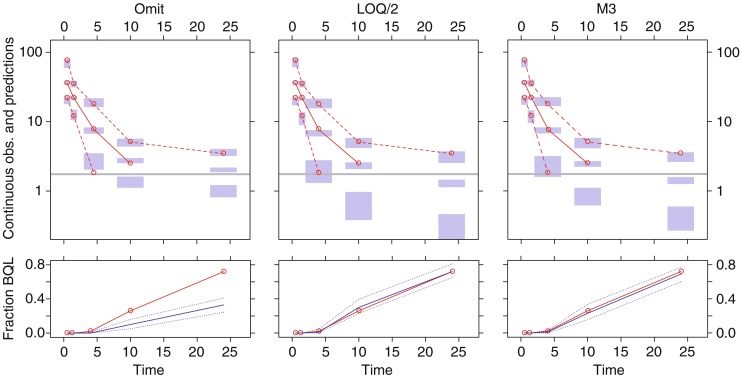
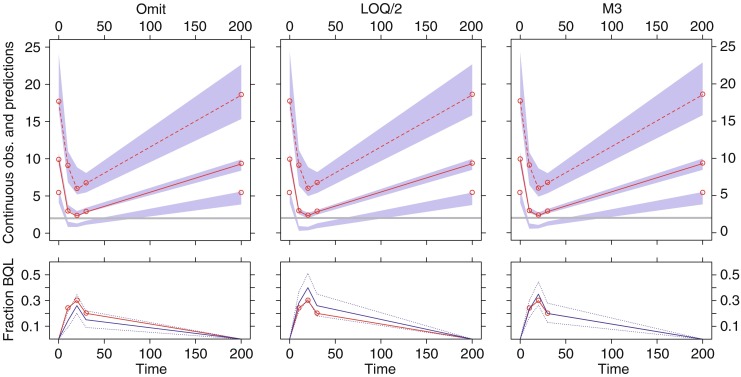
The purpose of this study is to investigate the impact of observations below the limit of quantification (BQL) occurring in three distinctly different ways and assess the best method for prevention of bias in parameter estimates and for illustrating model fit using visual predictive checks (VPCs). Three typical ways in which BQL can occur in a model was investigated with simulations from three different models and different levels of the limit of quantification (LOQ). Model A was used to represent a case with BQL observations in an absorption phase of a PK model whereas model B represented a case with BQL observations in the elimination phase. The third model, C, an indirect response model illustrated a case where the variable of interest in some cases decreases below the LOQ before returning towards baseline. Different approaches for handling of BQL data were compared with estimation of the full dataset for 100 simulated datasets following models A, B, and C. An improved standard for VPCs was suggested to better evaluate simulation properties both for data above and below LOQ. Omission of BQL data was associated with substantial bias in parameter estimates for all tested models even for seemingly small amounts of censored data. Best performance was seen when the likelihood of being below LOQ was incorporated into the model. In the tested examples this method generated overall unbiased parameter estimates. Results following substitution of BQL observations with LOQ/2 were in some cases shown to introduce bias and were always suboptimal to the best method. The new standard VPCs was found to identify model misfit more clearly than VPCs of data above LOQ only.


Figures

Fig. 1
Fig. 1
Box-plots depicting parameter estimates (n = 100 per box) divided by true parameter values for a selection of parameters from model A. Absorption rate constant (KA), mean transit time (MTT), number of transit compartments (NTC) and corresponding interindividual variability (IIV). Results presented for method a, b, c (Laplacian), d and e and for LOQ level I, II and III
Fig. 2
Fig. 2
Box-plots depicting parameter estimates (n = 100 per box) divided by true parameter values for a selection of parameters from model B. Clearance (CL), inter-compartment clearance (Q), peripheral distribution volume (VP), and corresponding inter-individual variability (IIV). Results presented for method a, b, c (Laplacian), d and e and for LOQ level I, II and III
Fig. 3
Fig. 3
Box-plots depicting parameter estimates (n = 100 per box) divided by true parameter values for a selection of parameters from model C. Drug concentration effect on K out (SLOP), first order elimination constantan (KOUT), baseline (BASE), and corresponding inter-individual variability (IIV). Results presented for method a, b, c (Laplacian), d and e and for LOQ level I, II and III
Fig. 4
Fig. 4
Example of visual predictive check (VPC) for model B (LOQ level II) following estimation with BQL data omitted (left), BQL dataset to LOQ/2 (middle), and the M3 method (right). The upper panels show simulation-based 95% confidence intervals around the 97.5th, 50th, and 2.5th percentiles of the continuous data in the form of blue areas. The corresponding percentiles from the observed data are plotted in red color (can only be plotted for observations above LOQ). The horizontal gray line represents the LOQ. The lower panels show simulation based 95% confidence intervals (dotted blue line) around the median (solid blue line) for the fraction of BQL observations. The observed fraction BQL samples are represented with a dashed red line
Fig. 5
Fig. 5
Example of visual predictive check (VPC) for model C (LOQ level II) following estimation with BQL data omitted (left), BQL dataset to LOQ/2 (middle), and the M3 method (right). The upper panels show simulation-based 95% confidence intervals around the 97.5th, 50th, and 2.5th percentiles of the continuous data in the form of blue areas. The corresponding percentiles from the observed data are plotted in red color (can only be plotted for observations above LOQ). The horizontal gray line represents the LOQ. The lower panels show simulation based 95% confidence intervals (dotted blue line) around the median (solid blue line) for the fraction of BQL observations. The observed fraction BQL samples are represented with a dashed red line
Fig. 6
Fig. 6
Mean parameter estimates for estimations with successful versus non-successful minimization for model A and estimation alternatives using the Laplacian estimation method. Suspected outliers complemented with error bars representing a 95% confidence interval. Results are presented for each parameter and method. Typical parameter values are presented in the right panel and inter-individual variability (IIV) parameters to the left

Similar articles

Cited by

References

    1. FDA guidance for industry bioanalytical method validation. http://www.fdagov/cder/guidance/4252fnl.pdf (accessed 05/05/2007).
    1. Duval V, Karlsson MO. Impact of omission or replacement of data below the limit of quantification on parameter estimates in a two-compartment model. Pharm Res. 2002;19(12):1835–1840. doi: 10.1023/A:1021441407898. - DOI - PubMed
    1. Bergstrand M, Plan E, Kjellsson M, Karlsson MO. A comparison of methods for handling of data below the limit of quantification in NONMEM VI. PAGE 16 (2007) Abstr 1201 [www.page-meeting.org/?abstract=1201].
    1. Hing JP, Woolfrey SG, Greenslade D, Wright PM. Analysis of toxicokinetic data using NONMEM: impact of quantification limit and replacement strategies for censored data. J Pharmacokinet Pharmacodyn. 2001;28(5):465–479. doi: 10.1023/A:1012247131190. - DOI - PubMed
    1. Beal SL. Ways to fit a PK model with some data below the quantification limit. J Pharmacokinet Pharmacodyn. 2001;28(5):481–504. doi: 10.1023/A:1012299115260. - DOI - PubMed

LinkOut - more resources