Review
. 2009 Aug;40(1):55-72.
doi: 10.1007/s12035-009-8071-2. Epub 2009 May 19.

Myelin proteomics: molecular anatomy of an insulating sheath

Affiliations
Review

Myelin proteomics: molecular anatomy of an insulating sheath

Olaf Jahn et al. Mol Neurobiol. 2009 Aug.

Abstract

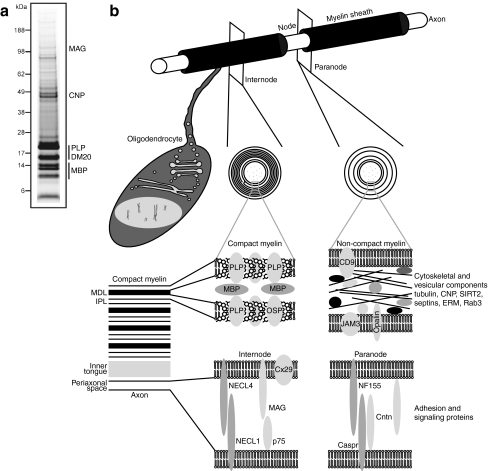
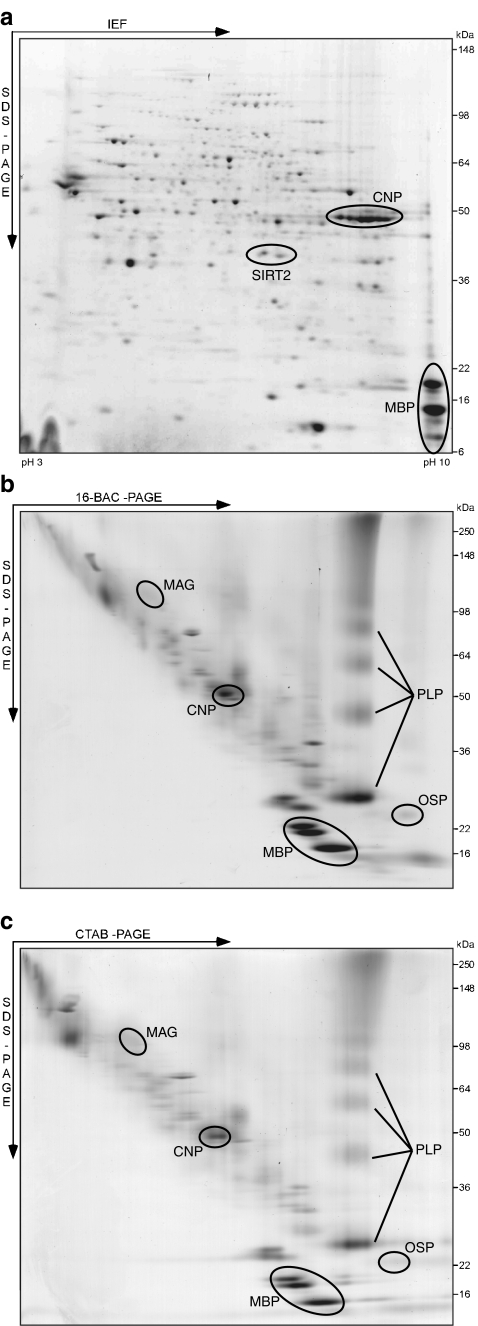
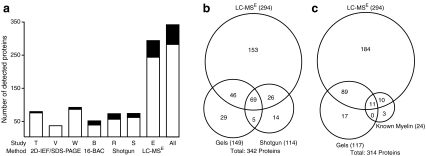
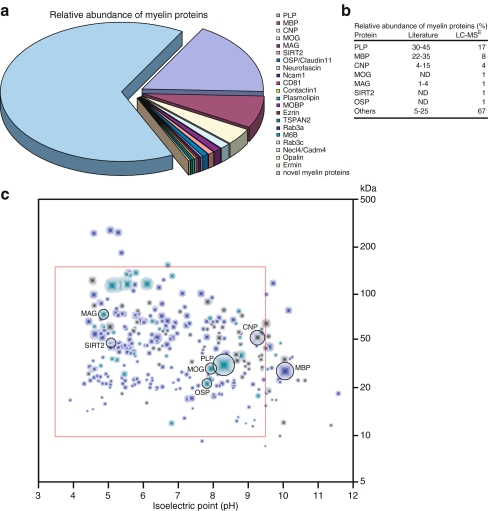
Fast-transmitting vertebrate axons are electrically insulated with multiple layers of nonconductive plasma membrane of glial cell origin, termed myelin. The myelin membrane is dominated by lipids, and its protein composition has historically been viewed to be of very low complexity. In this review, we discuss an updated reference compendium of 342 proteins associated with central nervous system myelin that represents a valuable resource for analyzing myelin biogenesis and white matter homeostasis. Cataloging the myelin proteome has been made possible by technical advances in the separation and mass spectrometric detection of proteins, also referred to as proteomics. This led to the identification of a large number of novel myelin-associated proteins, many of which represent low abundant components involved in catalytic activities, the cytoskeleton, vesicular trafficking, or cell adhesion. By mass spectrometry-based quantification, proteolipid protein and myelin basic protein constitute 17% and 8% of total myelin protein, respectively, suggesting that their abundance was previously overestimated. As the biochemical profile of myelin-associated proteins is highly reproducible, differential proteome analyses can be applied to material isolated from patients or animal models of myelin-related diseases such as multiple sclerosis and leukodystrophies.


Figures

Fig. 1
Fig. 1
CNS myelin. a Purified mouse brain myelin was one-dimensionally separated in a 4–12% Bis–Tris gradient gel using a morpholineethanesulfonic acid buffer system. Proteins were visualized by colloidal Coomassie staining. Bands constituted by abundant myelin proteins are annotated. b Schematic depiction of an oligodendrocyte myelinating an axon, cross-sections in the internodal and paranodal segments, and subcellular localization of myelin proteins. Structural proteins of compact myelin (middle), cytoskeletal and vesicular proteins located in uncompacted regions (right), and adhesion proteins mediating association with the axon (bottom) are shown. CNP 2′,3′-cyclic nucleotide phosphodiesterase, Cntn contactin, Caspr contactin-associated protein, Cx29 connexin 29 kDa, DM20 small splice isoform of PLP, ERM ezrin, radixin, moesin, IPL intraperiod line, JAM3 junctional adhesion molecule 3, MAG myelin-associated glycoprotein, MBP myelin basic protein, MDL major dense line, Necl nectin-like protein, NF155 neurofascin 155 kDa, OSP oligodendrocyte-specific protein/claudin-11, PLP proteolipid protein, Rab3 Ras-related protein Rab3, SIRT2 sirtuin 2
Fig. 2
Fig. 2
Gel-based myelin proteome maps. Purified mouse brain myelin was two-dimensionally separated in different gel systems. Proteins were visualized by colloidal Coomassie staining, and spots constituted by selected myelin proteins are indicated. a 2D-IEF/SDS-PAGE with IEF in a nonlinear pH gradient (pH 3–10) as the first and gradient SDS-PAGE (8–16% acrylamide) as the second dimension. To improve resolution, myelin was delipidated and precipitated by a methanol/chloroform treatment prior to IEF [25]. b 2D-16-BAC/SDS-PAGE with separation in a 16-BAC gel (10% acrylamide) as the first and gradient SDS-PAGE (8–16% acrylamide) as the second dimension. c 2D-CTAB/SDS-PAGE with separation in a CTAB gel (10% acrylamide) as the first and gradient SDS-PAGE (8–16% acrylamide) as the second dimension. To deplete soluble and membrane-associated proteins, myelin was subjected to a multistep wash procedure before separation [25]. 16-BAC and CTAB resulted in similar spot patterns. 2D-IEF/SDS-PAGE provides good resolution but basic, hydrophobic, and transmembrane proteins are under-represented. 2D-16-BAC/SDS-PAGE and 2D-CTAB/SDS-PAGE lead to efficient representation of basic, hydrophobic, and transmembrane proteins but have a lower resolution since separation occurs by protein size in both dimensions
Fig. 3
Fig. 3
Assembling a compendium of myelin proteins. a The number of proteins identified by MS in different approaches to the CNS myelin proteome is plotted. The total number of myelin-associated proteins is unknown. Transmembrane proteins (black) have been categorized based on prior experimental studies or have been predicted using TMHMM and Phobius software. Proteins associated with mitochondria, which copurify with myelin, were omitted. T 2D-IEF/SDS-PAGE [95], V 2D-IEF/SDS-PAGE [97], W 2D-IEF/SDS-PAGE [25], B 2D-16-BAC/SDS-PAGE [25], R shotgun [23], S shotgun [97], E LC-MSE (Tenzer et al., unpublished). b Venn diagram comparing the number of myelin-associated proteins identified by MS after gel separation [25, 95, 97], previous gel-free shotgun approaches by LC/LC-MS/MS [23, 97], with those identified by LC-MSE (Tenzer et al., unpublished). Note the high overlap of proteins identified independent of the technique used. c Venn diagram showing our own experience with the identification of myelin-associated proteins by MS after combined 2D-IEF/SDS-PAGE and 2D-16-BAC/SDS-PAGE separation [25] or by LC-MSE with known myelin proteins according to the literature
Fig. 4
Fig. 4
Relative abundance of myelin proteins. a The abundance of known myelin proteins was determined by LC-MSE. Note that known myelin proteins constitute less than 50% of the total myelin protein. Mitochondrial proteins were not considered. b Comparison of myelin protein abundance as quantified by LC-MSE with previous estimates based on band intensity after 1D-PAGE and various protein staining techniques [19, 85, 87, 88]. Note that the abundance of PLP and MBP was previously overestimated because low abundant proteins did not constitute significant bands due to limitations in the resolving power of the 1D gels and in the dynamic range of protein staining. c Simulated 2D map of myelin-associated proteins identified by LC-MSE. Proteins are indicated as dots at their molecular weight and isoelectric point as predicted from the amino acid sequence. The size of each dot reflects the relative abundance as determined by LC-MSE. Myelin-associated proteins without transmembrane domains are shown in blue and transmembrane proteins in green, the latter being usually under-represented or absent from conventional 2D gels. Mitochondrial proteins are shown in gray. The red frame indicates the portion of proteins that can be reproducibly displayed by 2D-IEF/SDS-PAGE (see Fig. 2a)

References

    1. Hartline DK, Colman DR (2007) Rapid conduction and the evolution of giant axons and myelinated fibers. Curr Biol 17:R29–R35 - PubMed
    1. Poliak S, Peles E (2003) The local differentiation of myelinated axons at nodes of Ranvier. Nat Rev Neurosci 4:968–980 - PubMed
    1. Hildebrand C, Remahl S, Persson H, Bjartmar C (1993) Myelinated nerve fibres in the CNS. Prog Neurobiol 40:319–384 - PubMed
    1. Kirby BB, Takada N, Latimer AJ, Shin J, Carney TJ, Kelsh RN, Appel B (2006) In vivo time-lapse imaging shows dynamic oligodendrocyte progenitor behavior during zebrafish development. Nat Neurosci 9:1506–1511 - PubMed
    1. Brosamle C, Halpern ME (2002) Characterization of myelination in the developing zebrafish. Glia 39:47–57 - PubMed

Publication types