Comparative Study
. 2008 Mar;2(2):41-51.
doi: 10.1111/j.1750-2659.2008.00038.x.

Whole inactivated virus influenza vaccine is superior to subunit vaccine in inducing immune responses and secretion of proinflammatory cytokines by DCs

Affiliations
Comparative Study

Whole inactivated virus influenza vaccine is superior to subunit vaccine in inducing immune responses and secretion of proinflammatory cytokines by DCs

Felix Geeraedts et al. Influenza Other Respir Viruses. 2008 Mar.

Abstract

Background: For protection against (re-)infection by influenza virus not only the magnitude of the immune response but also its quality in terms of antibody subclass and T helper profile is important. Information about the type of immune response elicited by vaccination is therefore urgently needed.

Objectives: The aim of the study was to evaluate in detail the immune response elicited by three current influenza vaccine formulations and to shed light on vaccine characteristics which determine this response.

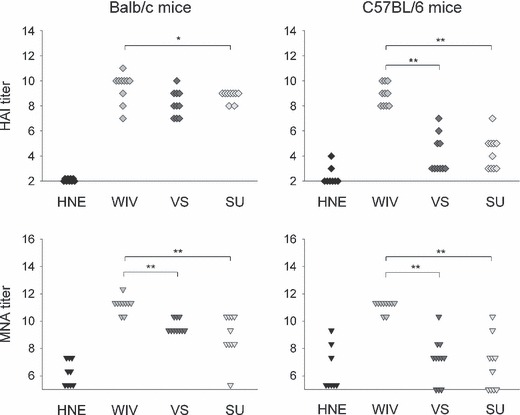
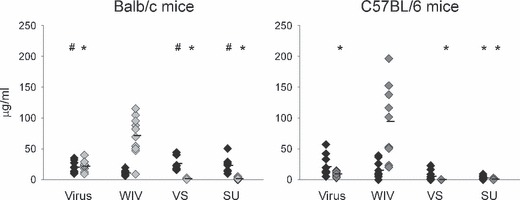
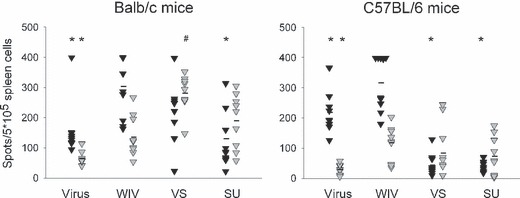
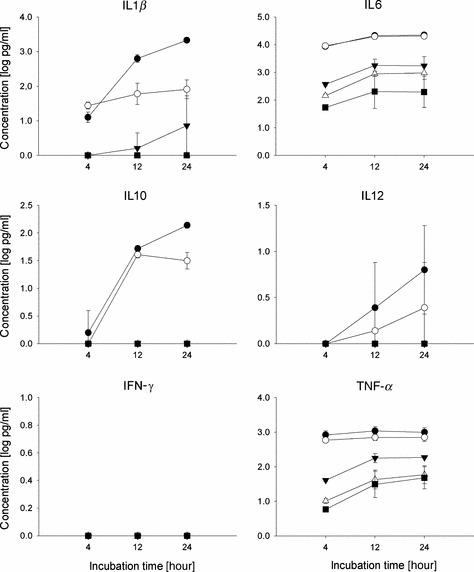
Methods: Mice were immunized with whole inactivated virus (WIV), virosomes (VS) or subunit vaccine (SU). Following subsequent infection with live virus, serum antibody titers and Th cell responses were measured. The effects of the vaccines on cytokine production by conventional and plasmacytoid dendritic cells were investigated in vitro.

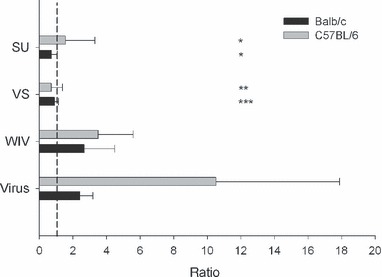
Results and conclusions: In Balb/c mice (Th2 prone) as well as in C57Bl/6 mice (Th1 prone), WIV induced consistently higher hemagglutination-inhibition titers and virus-neutralizing antibody titers than VS or SU. In contrast to VS and SU, WIV stimulated the production of the antibody subclasses IgG2a (Balb/c) and IgG2c (C57BL/6), considered to be particularly important for viral clearance, and activation of IFN-gamma-producing T cells. Similar to live virus, WIV stimulated the production of proinflammatory cytokines by conventional dendritic cells and IFN-alpha by plasmacytoid cells, while VS and SU had little effect on cytokine synthesis by either cell type. We conclude that vaccination with WIV in contrast to VS or SU results in the desired Th1 response presumably by induction of type I interferon and other proinflammatory cytokines.


Figures

Figure 1
Figure 1
HAI titers and VN titers after immunization followed by virus challenge. Mice (9–10/experimental group) were injected i.m. with buffer (HNE) or were vaccinated by i.m. injection on day 0 with 5 μg of HA derived from strain A/Panama/2007/99 (H3N2) formulated as WIV, VS or SU vaccine and were i.n. infected on day 28 with A/Panama virus. Three days later mice were killed. HAI titers and VN titers were determined in individual sera as described in Materials and methods. Results are given as log2 titers. The detection limit was 2 for HAI determination and 5·3 for VN determination. Significant (P < 0·05) and highly significant (P < 0·01) differences between WIV and the other vaccine formulations are indicated by * and ** respectively.
Figure 2
Figure 2
IgG subtypes after immunization and subsequent virus challenge. Mice were treated as described in the caption to Figure 1. An additional group of mice was i.n. infected on day 0 with 150 HAU of live A/Panama virus (virus) and received a second dose of virus 150 HAU on day 28. IgG1 (black diamonds) and IgG2a (light gray diamonds) or IgG2c (dark gray diamonds) were determined by an ELISA and amounts were calculated using IgG1, IgG2a and IgG2c standards. Responses significantly lower or higher than those induced by WIV (P < 0·05) are indicated by # and * respectively.
Figure 3
Figure 3
T helper responses after immunization followed by virus challenge. Splenocytes obtained from the mice described in the legend to Figure 1 were used to perform ELISPOT assays for enumeration of IFN‐γ‐ (black triangles) and IL4 (gray triangles)‐producing T helper cells. Cells were stimulated overnight before lysis and detection of the respective cytokines. Responses significantly lower or higher than those induced by WIV (P < 0·05) are indicated by # and * respectively.
Figure 4
Figure 4
Ratios of IFN‐γ‐ and IL4‐producing T cells (Th1/Th2 ratio) after immunization and challenge. Ratios were calculated for each individual mouse and are given as mean (±SD) per experimental group. A ratio of 1 representing a perfectly balanced response is indicated by a stipple line. ***3/9 mice ratio >1, **2/10 mice ratio >1, *1/10 mice ratio >1.
Figure 5
Figure 5
Cytokine production of conventional DCs upon exposure to virus or vaccines. Bone marrow cells were cultured for 9 days with GM‐CSF to obtain cDCs. On day 9, cells were exposed to live influenza virus (closed circles), WIV (open circles), VS (closed triangles) or SU (open triangles) for the periods indicated or were left untreated (black squares). Supernatants were harvested and cytokines were determined using Luminex technology. Results shown are the mean of two independent experiments. Each supernatant was measured in duplicate.
Figure 6
Figure 6
Production of IFN‐α by plasmacytoid DCs after exposure to virus or vaccines. (A) Splenocytes derived from Balb/c mice were enriched for pDCs as described in Materials and methods. Cells were incubated for 20 hours with the indicated amounts of HA using either live virus (filled circles), WIV (open circles), VS (filled triangles) or SU vaccine (open triangles). Supernatants were harvested and IFN‐α was determined by a sandwich ELISA. Results of a representative experiment are shown. (B) Crude splenocytes (black bar) and splenocytes enriched for pDCs as above (gray bar) were incubated for 20 hours with 0·1 μg of WIV. Supernatants were analysed for IFN‐α as above. (C) Flt3 ligand cultured bone marrow cells were exposed to 0·1 μg of WIV (white bar) or SU vaccine (black bar for 20 hours and IFN‐α in the supernatants was analyzed as above.

References

    1. Stöhr K, Kieny M, Wood D. Influenza pandemic vaccines: how to ensure a low‐cost, low‐dose option. Nat Rev Micro 2006; 4:565–566. - PubMed
    1. World Health Organization . Avian influenza assessing the pandemic threat, 2005. Available at: http://www.who.int/crs/desease/infuenza/WHO_CDS_2005_29/en/.
    1. Murray CJ, Lopez AD, Chin B, Feehan D, Hill KH. Estimation of potential global influenza mortality on the basis of vital registry data from the 1918–20 pandemic: a quantitative analysis. Lancet 2006; 368:2211–2218. - PubMed
    1. Wilschut JC, McElhaney JE, Palache AM. Vaccination: cornerstone of influenza control In: Wilschut JC, McElhaney JE, Palache AM, eds. Influenza. Amsterdam: Elsevier, 2006; 150–183.
    1. Stegmann T, Morselt HW, Booy FP, Van Breemen JF, Scherphof G, Wilschut J. Functional reconstitution of influenza virus envelopes. EMBO J 1987; 6:2651–2659. - PMC - PubMed

Publication types