. 2009 Sep;13(9B):3343-57.
doi: 10.1111/j.1582-4934.2009.00782.x. Epub 2009 May 13.

GARP: a key receptor controlling FOXP3 in human regulatory T cells

Affiliations

GARP: a key receptor controlling FOXP3 in human regulatory T cells

M Probst-Kepper et al. J Cell Mol Med. 2009 Sep.

Abstract

Recent evidence suggests that regulatory pathways might control sustained high levels of FOXP3 in regulatory CD4(+)CD25(hi) T (T(reg)) cells. Based on transcriptional profiling of ex vivo activated T(reg) and helper CD4(+)CD25(-) T (T(h)) cells we have identified GARP (glycoprotein-A repetitions predominant), LGALS3 (lectin, galactoside-binding, soluble, 3) and LGMN (legumain) as novel genes implicated in human T(reg) cell function, which are induced upon T-cell receptor stimulation. Retroviral overexpression of GARP in antigen-specific T(h) cells leads to an efficient and stable re-programming of an effector T cell towards a regulatory T cell, which involves up-regulation of FOXP3, LGALS3, LGMN and other T(reg)-associated markers. In contrast, overexpression of LGALS3 and LGMN enhance FOXP3 and GARP expression, but only partially induced a regulatory phenotype. Lentiviral down-regulation of GARP in T(reg) cells significantly impaired the suppressor function and was associated with down-regulation of FOXP3. Moreover, down-regulation of FOXP3 resulted in similar phenotypic changes and down-regulation of GARP. This provides compelling evidence for a GARP-FOXP3 positive feedback loop and provides a rational molecular basis for the known difference between natural and transforming growth factor-beta induced T(reg) cells as we show here that the latter do not up-regulate GARP. In summary, we have identified GARP as a key receptor controlling FOXP3 in T(reg) cells following T-cell activation in a positive feedback loop assisted by LGALS3 and LGMN, which represents a promising new system for the therapeutic manipulation of T cells in human disease.


Figures

Figure 1
Figure 1
GARP is exclusively induced in CD4+CD25hi-derived Treg cells. (A) Human CD4+CD25hi Treg and CD4+CD25 T cells were sorted to a purity of >99% and analysed ex vivo (no stim.) and 24 hrs after stimulation using anti-CD3/IL-2 and anti-CD3/anti-CD28/IL-2. GARP signal intensity as determined by GenChip analysis and is represented normalized to the signal of RPS9. (B) Confirmation by real-time RT-PCR analysis of GARP (upper panel) and FOXP3 (lower panel) mRNA expression in independently sorted CD4+CD25hi Treg and CD4+CD25 Th cells analysed ex vivo (t0h), 12, 48 hrs and day 9 after stimulation with anti-CD3/anti-CD28 Dynalbeads at a ratio of 1:1 and IL-2. Relative mRNA expression of CD4+CD25 Th cells at time t0 was arbitrarily set as 1. (C) The same CD4+CD25hi Treg cells as in (B) were tested for suppressor function of alloantigen-stimulated CD4+CD25 Th cells at a ratio of 1 to 1. Proliferation was assessed at day 3 by measuring incorporation of H3-thymidin (cpm). (D) Fourier shell correlation of refinement process and EOTEST are shown (left part). The values 1.4 and 1.8 correspond to the estimated resolution of 14 and 18 Å. The insert is an asymmetric triangular showing the distribution of the particles’ orientations. Representative gallery of projections of the single particles alternating with the corresponding class averages is shown on the right. (E) Surface display of the 3D reconstruction together with a ribbon representation of the model of human GARP. The asparagine residues of putative glycosylation sites are indicated as space-filling spheres coloured according to atom type (carbon light brown, oxygen red, nitrogen blue). (F) Western blot analysis of alloantigen-specific Treg and Th cells without or with retroviral overexpression of GARP, FOXP3, LGMN, LGALS3, and GFP under resting and activated conditions using anti-CD3/IL-2 stimulation for 3 days using anti-GARP specific mAb 50G10; anti-Tubulin served as loading control. (G) Detection of cell surface expression of wt GARP and mutant GARPΔPDZ expressed in 293 cells (left panel) using mAb 272G6 compared to WB detection in the same cells (insert) using mAb 50G10. (H) Treg and Th cells as in (F) were treated for 4 hrs with PMA (40 ng/ml) and ionomycine (0.5 μg/ml) to induce up-regulation of the early-induced gene CD83 (lower panel) and tested for surface expression of GARP (upper panel).
Figure 2
Figure 2
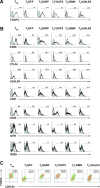
Ectopic expression of GARP in human alloantigen-specific Th cells induces sustained expression of FOXP3. (A) Th cells as in Fig. 1F were analysed for FOXP3 and (B) CD25, CTLA4, LGALS3, CD27, CD33, GITR and CD83 expression by flow cytometry under resting conditions. (C) The same cells as in (A) were stimulated for 3 days with cognate antigen and 50 U/ml IL-2 and analysed for FOXP3 and LGALS3 protein expression. Gates for figures (A–C) were set according to non-stained control (CD25) or isotype control (CTLA4, LGALS3, FOXP3, CD33, CD83, GITR) represented as shaded histogram (A, B) or set as quadrant (C); percentage of positive cells is indicated. Treg cells were included for comparison (A–C).
Figure 3
Figure 3
GARP induces Treg-signature of transcriptional control. (A) Resting and anti-CD3/IL-2 stimulated T cells as in Figs 1 and 2 were analysed for mRNA expression of IL-2 by real-time RT-PCR. The individual fold change of relative mRNA expression of indicated Th and Treg cells were compared to ThGFP cells, arbitrarily set as 1, is indicated.; n.d. = not detected. (B) K-Means clusterization of significantly regulated genes in Treg, ThGARP and ThFOXP3 cells compared to ThGFP cells, all stimulated for 3 days with anti-CD3/IL-2. The heat map represent signal log ratios. Numbers correspond to clusters of Table S2. (C) Real-time RT-PCR analysis of KLF-2 expression in anti-CD3/IL-2 stimulated Th cells transduced with GARP, FOXP3 or GFP. Relative mRNA expression of ThGFP cells was arbitrarily set as 1 (upper panel). Real-time RT-PCR analysis of KLF-2 mRNA in Th cells transduced with LGALS3 and LGMN; Th cells transduced with GFP, GARP, and parental cells without transduction (ThGFP-) served as control (cell line ThB). Relative mRNA expression of ThGFP- cells was arbitrarily set as 1 (lower panel). (D) FOXP3 expressio5n in antigen-specific Th cells separated for different levels of CD33 expression (ThCD33+ and ThCD33− cells, respectively) by cell sorting following stimulation for 3 days using cognate antigen and IL-2. Isotype control = grey filled, FOXP3 = bold black. (E) The same cells as in (D) were analysed for cell surface CD83 and CD33 expression following stimulation with cognate antigen and IL-2 for 3 days. (F) A5 cells, transduced with GARP, mutant GARPΔPDZ or control lentiviral vector were analysed for GFP expression without (grey filled) and with 1 μg/ml Ionomycine stimulation for 2 (thin line) and 4 (thick line) hrs (upper panel);% GFP is represented. Lower panel represents the corresponding cell surface expression of GARP, detected with mAb 272G6 as in Fig. 1.
Figure 4
Figure 4
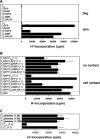
Anergy and suppressor function induced by overexpression of GARP in human alloantigen-specific Th cells. (A) Treg cells and Th cells as in Figs 1–3 were stimulated for proliferation using irradiated allogeneic EBV B cells (stim.); bkg. = background proliferation. Proliferation was assessed at day 3 by measuring incorporation of H3-thymidin (cpm). (B) Treg and Th cells as in (A) were tested for suppressor function of alloantigen-stimulated ThGFP cells at a ratio of 1 to 1 either separated by a transwell membrane (no contact, upper panel) or without separation (cell contact, middle panel); lower panel represents induced ThGFP cell proliferation without the addition of a potential suppressor or control cell population. Proliferation was assessed at day 3. Similar results were obtained using antigen-specific Th cells as responder cells instead of ThGFP cells (Fig. S6B). (C) Single donor platelets as natural source of GARP+ cells was tested for suppressor function of alloantigen-stimulated Th cells at indicated ratios as in (B); addition of Th and Treg cells as in (B) at a ratio of 1:1 were included as negative and positive control of suppressor function, respectively.
Figure 5
Figure 5
Positive feedback loop between GARP and FOXP3 in human Treg cells. (A) Real-time RT-PCR analysis of GARP and FOXP3 expression in human Treg cells, lentivirally transduced with siRNA constructs specific for FOXP3 (TregsiFOXP34), GARP (TregsiGARP4) or non-specific control (TregsiGL4). Relative mRNA expression of Th cells was arbitrarily set as 1. (B) The same cells as in (A) were analysed for surface expression of CD83, CD27, and CD25 following antigen-specific stimulation with EBV B cells and IL-2. (C) Impairment of suppressor function of TregsiFOXP34 and TregsiGARP1 cells of compared to TregsiGL4 cells was assessed in a suppressor assay at a cell ratio of 1:1 as described in Fig. 4. (D) Relative expression of GARP and FOXP3 mRNA in the indicated thymic T-cell subsets of normal donors (open symbols), assessed by TaqMan assay, normalized to the expression of β-actin, is represented; black symbols = mean of relative mRNA expression, rel. = relative, *=P < 0.002 by 2-sided Student’s t-test.
Figure 6
Figure 6
Simplified model of the reprogramming or ‘transdifferentation’ of effector towards regulatory T cells via the GARP-FOXP3 positive feedback loop. The upper part illustrates the change in the ‘quality’ of TCR signalling outcome from effector (green) towards regulatory (green) TCR signalling. Thus, each TCR stimulation enhances the positive feedback indicated by the size of the feedback loop illustrated in the middle. For simplicity, other components of the regulatory network described, like LGALS3, LGMN, CD33, CD27 and CD83 or direct impairment of NFAT by GARP have been excluded. Identification of further components, fine tuning, timed-sequential expression and interconnectivity between the components of the regulatory network represents a major challenge for the molecular definition of the regulatory program.

Similar articles

Cited by

References

    1. Ziegler SF. FOXP3: of mice and men. Annu Rev Immunol. 2006;24:209–26. - PubMed
    1. Fontenot JD, Rudensky AY. A well adapted regulatory contrivance: regulatory T cell development and the forkhead family transcription factor Foxp3. Nat Immunol. 2005;6:331–7. - PubMed
    1. Lin W, Haribhai D, Relland L, et al. Regulatory T cell development in the absence of functional Foxp3. Nat Immunol. 2007;8:359–68. - PubMed
    1. Schubert LA, Jeffery E, Zhang Y, et al. Scurfin (FOXP3) acts as a repressor of transcription and regulates T cell activation. J Biol Chem. 2001;276:37672–9. - PubMed
    1. Li B, Samanta A, Song X, et al. FOXP3 interactions with histone acetyltransferase and class II histone deacetylases are required for repression. PNAS. 2007;104:4571–6. - PMC - PubMed

Publication types

MeSH terms