. 2009 Apr 15;387(2):162-70.
doi: 10.1016/j.ab.2009.01.028. Epub 2009 Feb 10.

Glycan reductive isotope labeling for quantitative glycomics

Affiliations

Glycan reductive isotope labeling for quantitative glycomics

Baoyun Xia et al. Anal Biochem. .

Abstract

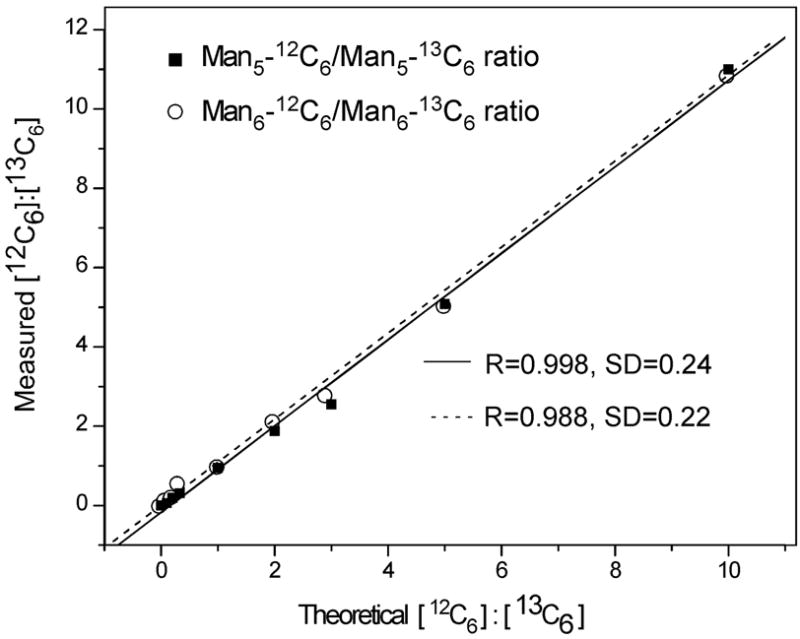
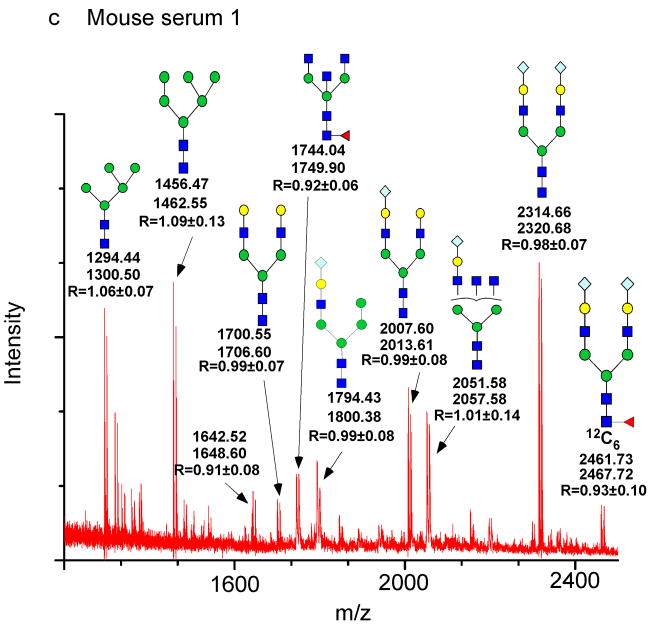
Many diseases and disorders are characterized by quantitative and/or qualitative changes in complex carbohydrates. Mass spectrometry methods show promise in monitoring and detecting these important biological changes. Here we report a new glycomics method, termed glycan reductive isotope labeling (GRIL), where free glycans are derivatized by reductive amination with the differentially coded stable isotope tags [(12)C(6)]aniline and [(13)C(6)]aniline. These dual-labeled aniline-tagged glycans can be recovered by reverse-phase chromatography and can be quantified based on ultraviolet (UV) absorbance and relative ion abundances. Unlike previously reported isotopically coded reagents for glycans, GRIL does not contain deuterium, which can be chromatographically resolved. Our method shows no chromatographic resolution of differentially labeled glycans. Mixtures of differentially tagged glycans can be directly compared and quantified using mass spectrometric techniques. We demonstrate the use of GRIL to determine relative differences in glycan amount and composition. We analyze free glycans and glycans enzymatically or chemically released from a variety of standard glycoproteins, as well as human and mouse serum glycoproteins, using this method. This technique allows linear relative quantitation of glycans over a 10-fold concentration range and can accurately quantify sub-picomole levels of released glycans, providing a needed advancement in the field of glycomics.


Figures

Figure 1
Figure 1. The strategy for using Glycan Reductive Isotope Labeling (GRIL) to analyze glycans
a: In this approach free glycans either occurring naturally or released from glycoproteins or glycolipids, for example, are derivatized with either [12C6]aniline or [13C6]aniline. b: The glycans labeled with either [12C6]aniline or [13C6]aniline are mixed and analyzed by MALDI-TOF-MS. c: Glycans with related compositions in the two mixed samples are identified as a mass difference of 6 Da doublets and differences in their relative amounts would be seen as quantitative differences in relative peak height with the 6 Da difference doublet. By contrast, glycans that are present in one sample but not another will be seen as unique peaks without a corresponding doublet with a mass difference of 6 Da. The structure of each glycan is shown with symbols as indicated.
Figure 2
Figure 2. Derivatization of LNnT with aniline is quantitative based on mass spectrometric analysis
The LNnT-aniline conjugate purified by adsorption to cellulose discs was subjected to ESI-MS analysis on an Agilent 1100 Series LC/MSD Trap, carried out in positive ion mode.
Figure 3
Figure 3
a: The [12C6]aniline and [13C6]aniline derivatives of LNnT behave identically on normal phase HPLC analysis. An equimolar mixture of LNnT-[12C6]aniline and LNnT-[13C6]aniline co-chromatographed during normal phase separation by HPLC. The aniline derivatives were detected using UV absorption at 260 nm. A profile showing the chromatographic behavior of purified LNnT-[12C6]aniline is inserted below as a reference. b: The 6 Da difference in [12C6]aniline and [13C6]aniline derivatives of LNnT are easily measured by ESI-MS analysis. The equimolar mixture of LNnT-[12C6]aniline and LNnT-[13C6]aniline was subjected to analysis by LC-MS. The structures are shown as symbols (Fig. 1) with the corresponding molecular masses.
Figure 3
Figure 3
a: The [12C6]aniline and [13C6]aniline derivatives of LNnT behave identically on normal phase HPLC analysis. An equimolar mixture of LNnT-[12C6]aniline and LNnT-[13C6]aniline co-chromatographed during normal phase separation by HPLC. The aniline derivatives were detected using UV absorption at 260 nm. A profile showing the chromatographic behavior of purified LNnT-[12C6]aniline is inserted below as a reference. b: The 6 Da difference in [12C6]aniline and [13C6]aniline derivatives of LNnT are easily measured by ESI-MS analysis. The equimolar mixture of LNnT-[12C6]aniline and LNnT-[13C6]aniline was subjected to analysis by LC-MS. The structures are shown as symbols (Fig. 1) with the corresponding molecular masses.
Figure 4
Figure 4
a: GRIL of glycans released by PNGase F from RNaseB. A mixture of free high mannose-type N-glycans Man5, Man6, Man7, Man8, and Man9 released by PNGase F digestion of RNaseB were labeled in separate reactions with [12C6]aniline or [13C6]aniline, mixed in exactly a 1:1 ratio and subjected to MALDI-TOF analysis. The masses of the individual glycans are shown associated with the most plausible structures represented with the symbols as shown in Fig. 1. For doublets found in the equimolar mixtures, the masses are shown below the structure and the ratio of the peak areas of glycan-[12C6]aniline: glycan-[13C6]aniline is shown (R). The inset represents an expansion of a portion of the spectrum. b: Use of GRIL to estimate relative amounts of glycan structures in glycan mixtures. N-glycans derived from RNase B were divided and separately derivatized with [12C6]aniline or [13C6]aniline and these were mixed in molar ratios of 10:1, 5:1, 3:1, 2:1, 1:1, 1:2, 1:3, 1:5, and 1:10 (based on absorption at 260 nm) and subjected to MALDI-TOF analysis. The linear relationship between expected ratios of heavy and light isotope included in the 8 mixtures and ratios calculated from the observed MALDI-TOF profiles of the Man5GlcNAc2-[12C6]aniline and -[13C6]aniline derivatives (■) and the Man6GlcNAc2-[12C6]aniline and -[13C6]aniline derivatives (○) are shown.
Figure 4
Figure 4
a: GRIL of glycans released by PNGase F from RNaseB. A mixture of free high mannose-type N-glycans Man5, Man6, Man7, Man8, and Man9 released by PNGase F digestion of RNaseB were labeled in separate reactions with [12C6]aniline or [13C6]aniline, mixed in exactly a 1:1 ratio and subjected to MALDI-TOF analysis. The masses of the individual glycans are shown associated with the most plausible structures represented with the symbols as shown in Fig. 1. For doublets found in the equimolar mixtures, the masses are shown below the structure and the ratio of the peak areas of glycan-[12C6]aniline: glycan-[13C6]aniline is shown (R). The inset represents an expansion of a portion of the spectrum. b: Use of GRIL to estimate relative amounts of glycan structures in glycan mixtures. N-glycans derived from RNase B were divided and separately derivatized with [12C6]aniline or [13C6]aniline and these were mixed in molar ratios of 10:1, 5:1, 3:1, 2:1, 1:1, 1:2, 1:3, 1:5, and 1:10 (based on absorption at 260 nm) and subjected to MALDI-TOF analysis. The linear relationship between expected ratios of heavy and light isotope included in the 8 mixtures and ratios calculated from the observed MALDI-TOF profiles of the Man5GlcNAc2-[12C6]aniline and -[13C6]aniline derivatives (■) and the Man6GlcNAc2-[12C6]aniline and -[13C6]aniline derivatives (○) are shown.
Figure 5
Figure 5. Use of GRIL to detect both qualitative and qualitative differences in glycan mixtures
Glycans released from human and mouse serums by PNGase F were separately labeled with [12C6]aniline and [13C6]aniline. a: The MALDI-TOF profile of an equimolar mixture of [12C6]aniline-glycans and [13C6]aniline-glycans from a single human serum sample (Human Serum 1). b: The MALDI-TOF profile of an equimolar mixture of [12C6]aniline-glycans and [13C6]aniline-glycans from two different human serum samples (Human Serum 1 + Human serum 2). c: The MALDI-TOF profile of an equimolar mixture of [12C6]aniline-glycans and [13C6]aniline-glycans from a single mouse serum sample (Mouse Serum 1). d: The MALDI-TOF profile of an equimolar mixture of [12C6]aniline-glycans from mouse serum and [13C6]aniline-glycans from human serum. The masses of the individual glycans are shown associated with the most plausible structures represented with the symbols as shown in Fig. 1 with masses of [13C6]aniline-glycans labeled in red and masses of [12C6]aniline-glycans labeled in blue. In the case of the doublets found in the equimolar mixtures, the masses are shown below the structure and the ratio of the peak areas of glycan-[12C6]aniline: glycan-[13C6]aniline is shown (R). The inset represents an expansion of a portion of the mass spectrum.

Similar articles

Cited by

References

    1. Endo T, Manya H. O-mannosylation in mammalian cells. Methods Mol Biol. 2006;347:43–56. - PubMed
    1. Butler M, Quelhas D, Critchley AJ, Carchon H, Hebestreit HF, Hibbert RG, Vilarinho L, Teles E, Matthijs G, Schollen E, Argibay P, Harvey DJ, Dwek RA, Jaeken J, Rudd PM. Detailed glycan analysis of serum glycoproteins of patients with congenital disorders of glycosylation indicates the specific defective glycan processing step and provides an insight into pathogenesis. Glycobiology. 2003;13:601–22. - PubMed
    1. Sun L, Eklund EA, Chung WK, Wang C, Cohen J, Freeze HH. Congenital disorder of glycosylation id presenting with hyperinsulinemic hypoglycemia and islet cell hyperplasia. J Clin Endocrinol Metab. 2005;90:4371–5. - PubMed
    1. Ju T, Cummings RD. Protein glycosylation: chaperone mutation in Tn syndrome. Nature. 2005;437:1252. - PubMed
    1. Teague RH, Fraser D, Clamp JR. Changes in monosaccharide content of mucous glycoproteins in ulcerative colitis. Br Med J. 1973;2:645–6. - PMC - PubMed

Publication types

LinkOut - more resources