Review
. 2009 Jun;86(3):165-73.
doi: 10.1016/j.yexmp.2009.01.005. Epub 2009 Jan 20.

Prospects for clinical cancer metabolomics using stable isotope tracers

Affiliations
Review

Prospects for clinical cancer metabolomics using stable isotope tracers

Andrew N Lane et al. Exp Mol Pathol. 2009 Jun.

Abstract

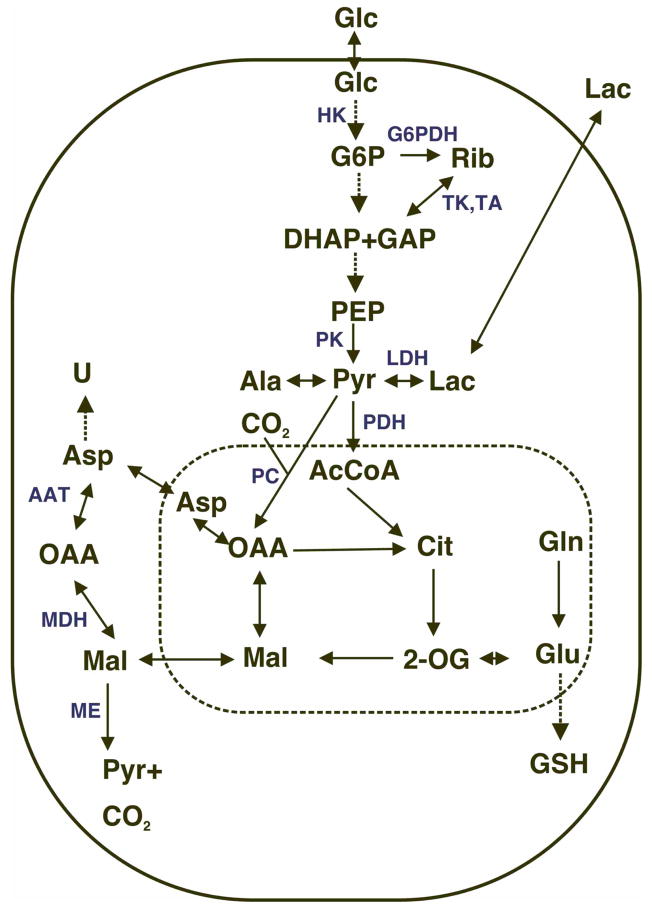
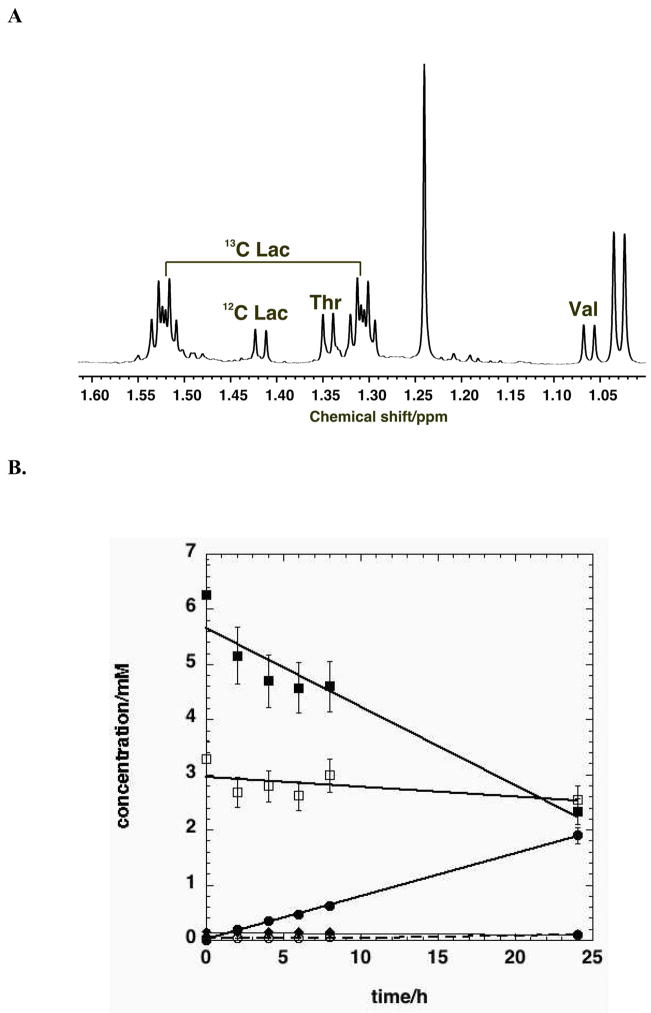
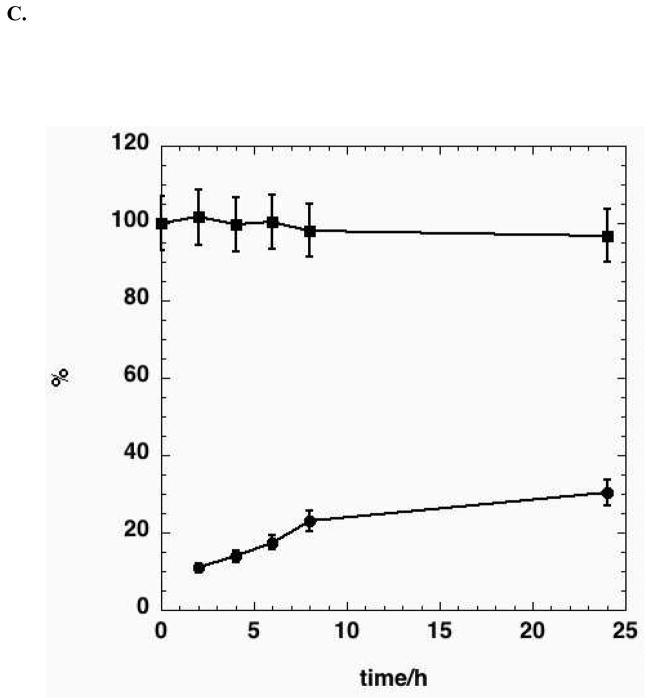
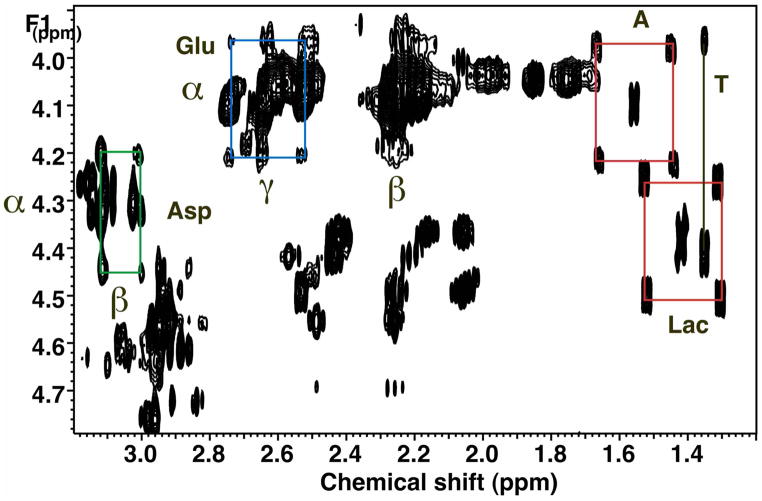
Metabolomics provides a readout of the state of metabolism in cells or tissue and their responses to external perturbations. For this reason, the approach has great potential in clinical diagnostics. For more than two decades, we have been using stable isotope tracer approaches to probe cellular metabolism in greater detail. The ability to enrich common compounds with rare isotopes such as carbon ((13)C) and nitrogen ((15)N) is the only practical means by which metabolic pathways can be traced, which entails following the fate of individual atoms from the source molecule to products via metabolic transformation. Changes in regulation of pathways are therefore captured by this approach, which leads to deeper understanding of the fundamental biochemistry of cells. Using lessons learned from pathways tracing in cells and organs, we have been applying this methodology to human cancer patients in a clinical setting. Here we review the methodologies and approaches to stable isotope tracing in cells, animal models and in humans subjects.


Conflict of interest statement

Conflict of Interest: The authors declare that there are no conflicts of interest.

Figures

Figure 1
Figure 1. Simple metabolic scheme
Carbon flow from [U-13C]-glucose through glycolysis, Krebs cycle, PPP, pyruvate carboxylation, malate/Asp shuttle, and synthesis of GSH and pyrimidine nucleotides. Solid oval represents the plasma membrane and the dashed oval represents the mitochondrial space. Double-headed arrows: exchange or reversible processes. Glc = glucose, G6P = glucose-6-phosphate, Rib = nucleotide ribose, DHAP, GAP = dihydroxyacetone phosphate and glyceraldehyde-3-phosphate, PEP = phosphoenolpyruvate, Pyr=pyruvate, Lac = lactate, Cit=citrate, 2=OG = 2-oxoglutarate, Mal=malate, OAA = oxalacetate, U = uracil base. Critical enzymes are shown in cyan. HK= hexokinase (entry to glycolysis), G6PDH = glucose-6-phosphate dehydrogenase (entry to the oxidative branch of the pentose phosphate pathway), TK, TA transketolase and transaldolase (non –oxidative pentose phosphate pathway), PK = pyruvate kinase, PDH = pyruvate dehydrogenase, PC = pyruvate carboxylase, AAT = aspartate amino transferase, MDH= malate dehydrogenase, ME = malic enzyme. Glutaminolysis is the pathway from Gln to pyruvate via ME, leading to unlabeled malate, Asp, Ala and lactate.
Figure 2
Figure 2. Time course of glucose consumption and lactate secretion from A549 cells
Human lung adenocarcinoma cells A549 were grown at 37 °C in RPMI 1640 medium containing [U-13C]-glucose in place of natural 12C glucose in 5% CO2 and 10% dialyzed FCS. Medium was sampled at different times, extracted with cold trichloracetic acid (Fan et al. 2008; Lane et al. 2008) and lyophilized. The polar metabolites remaining were redissolved in D2O and analyzed by NMR at 600 MHz. A. 1D spectrum showing the presence of 13C lactate. B. Time course of 12C (○) and 13C (●) lactate production and consumption of 13C glucose (■), Gln (□), Val (◆) and Thr (✧). Average of 4 parallel experiments. C. The fraction of lactate that is U-13C, and the fraction of glucose consumed converted to lactate was calculated as previously described (Lane et al. 2008). Average of 4 parallel experiments.
Figure 3
Figure 3. 2-D 1H TOCSY identified unlabeled and 13C-labeled metabolites in extracts
TCA extract of A549 cells grown in the presence of 5 mM [U-13C]-glucose for 24 h, as described for Figure 2. Boxes show the 13C satellite peaks of selected metabolites (Lac, Ala, Glu and Asp).
Figure 4
Figure 4. NMR spectra of plasma and tissue of NSCLC cancer patient
A patient was infused with 10 g [U-13C]-glucose 3 h prior to resection of the lung. The tumor and non-tumorous lung tissue was flash frozen and then extracted with cold TCA as described (Gradwell et al. 1998; Lane et al. 2008). A. 1D tissue: normal and cancer B. TOCSY spectrum of cancer
Figure 5
Figure 5. FT-ICRMS spectra of lung tumor lipids
Part A shows FT-ICR-MS spectra of phospholipid extracts, from the lungs of a single human subject. Note that overall, the spectra appear similar to each other, which is expected since most of the phospholipids serve functional roles as membrane structure. Part B shows the expansion of the region indicated in Part A, illustrating the three general categories of results for each of the hundreds to thousands of peaks obtained from each 10 minute sample run. Thus, this is a high-information throughput (HIT) technique. As illustrated, the most abundant lipids tend to be similar in profile, while many of the less abundant lipids decrease or increase in lung cancer relative to the non-cancerous lung tissue from the same patient. In this particular example, there are >1,000% differences in the indicated lipids, which are only two out of dozens of differences at this magnitude that are present.

References

    1. Altenberg B, Greulich KO. Genes of glycolysis are ubiquitously overexpressed in 24 cancer classes. Genomics. 2004;84:1014–1020. - PubMed
    1. Andreoli R, Manini P, Corradi M, Mutti A, Niessen WMA. Determination of patterns of biologically relevant aldehydes in exhaled breath condensate of healthy subjects by liquid chromatography/atmospheric chemical ionization tandem mass spectrometry. Rapid Communications in Mass Spectrometry. 2003;17:637–645. - PMC - PubMed
    1. Banerjee M, Huang C, Marquez J, Mohanty S. Probing the structure and function of human glutaminase-interacting protein: A possible target for drug design. Biochemistry. 2008;47:9208–9219. - PubMed
    1. Beger RD, Schnackenberg LK, Holland RD, Li DH, Dragan Y. Metabonomic models of human pancreatic cancer using 1D proton NMR spectra of lipids in plasma. Metabolomics. 2006;2:125–134.
    1. Boutrid H, Jockovich ME, Murray TG, Pina Y, Feuer WJ, Lampidis TJ, Cebulla CM. Targeting hypoxia, a novel treatment for advanced retinoblastoma. Investigative Ophthalmology & Visual Science. 2008;49:2799–2805. - PubMed

Publication types

LinkOut - more resources