. 2009 Jul 30;181(2):212-26.
doi: 10.1016/j.jneumeth.2009.05.006. Epub 2009 May 18.

Transgenic mice expressing a cameleon fluorescent Ca2+ indicator in astrocytes and Schwann cells allow study of glial cell Ca2+ signals in situ and in vivo

Affiliations

Transgenic mice expressing a cameleon fluorescent Ca2+ indicator in astrocytes and Schwann cells allow study of glial cell Ca2+ signals in situ and in vivo

Stan D Atkin et al. J Neurosci Methods. .

Abstract

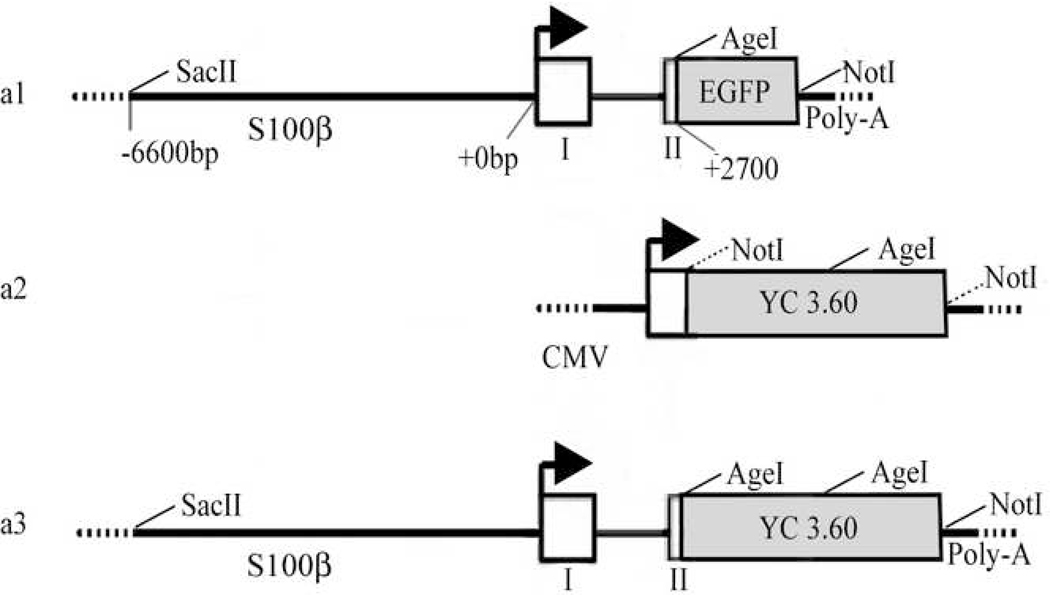
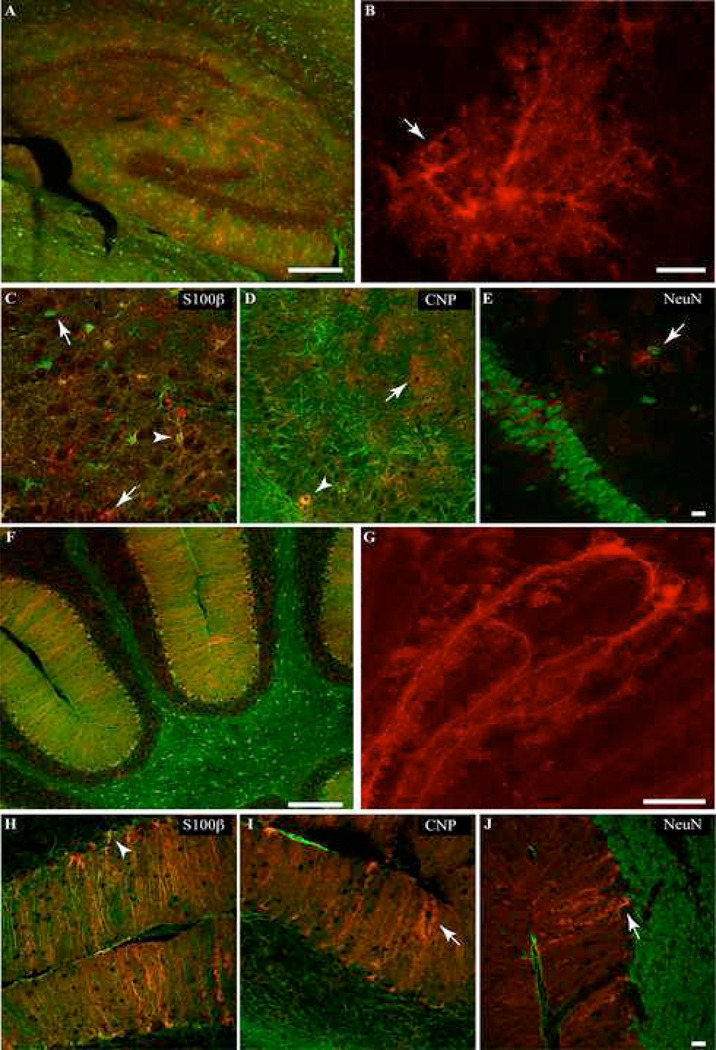
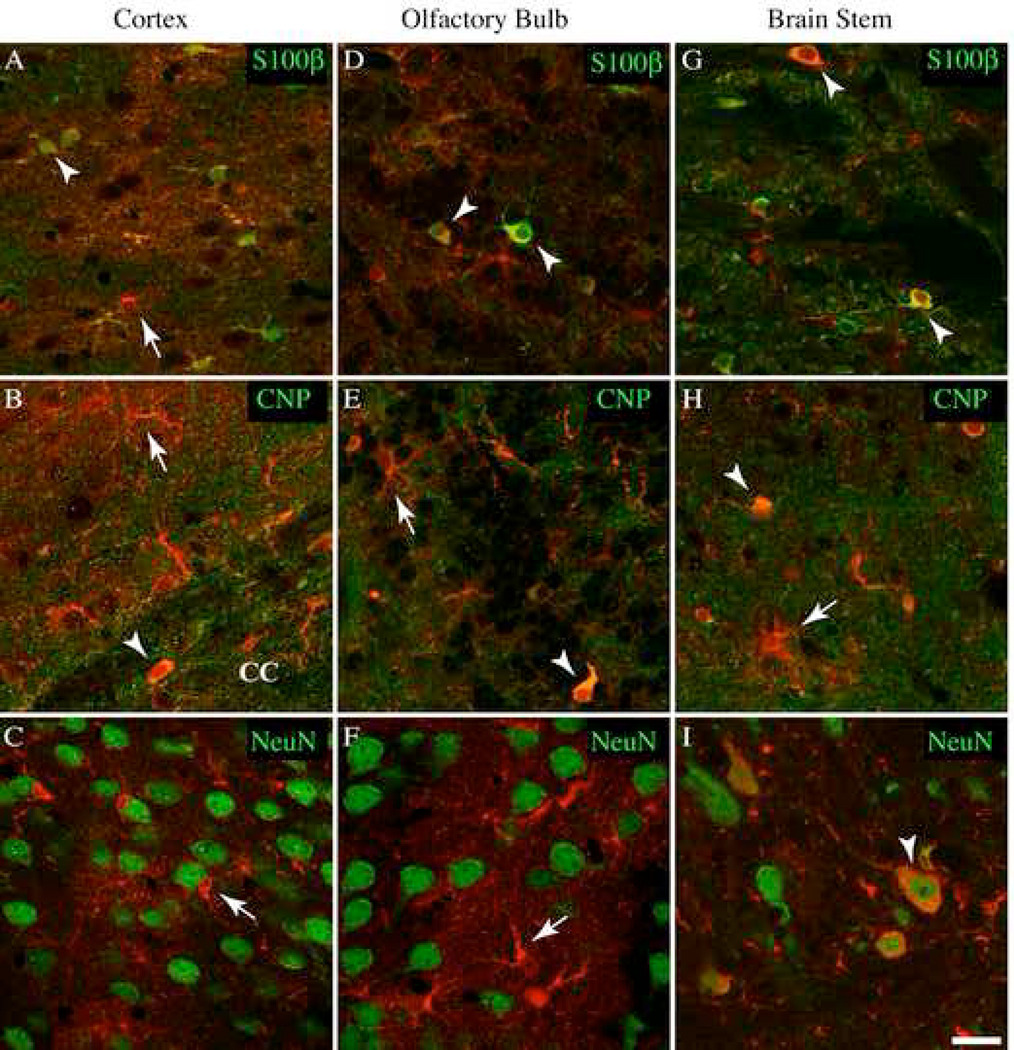
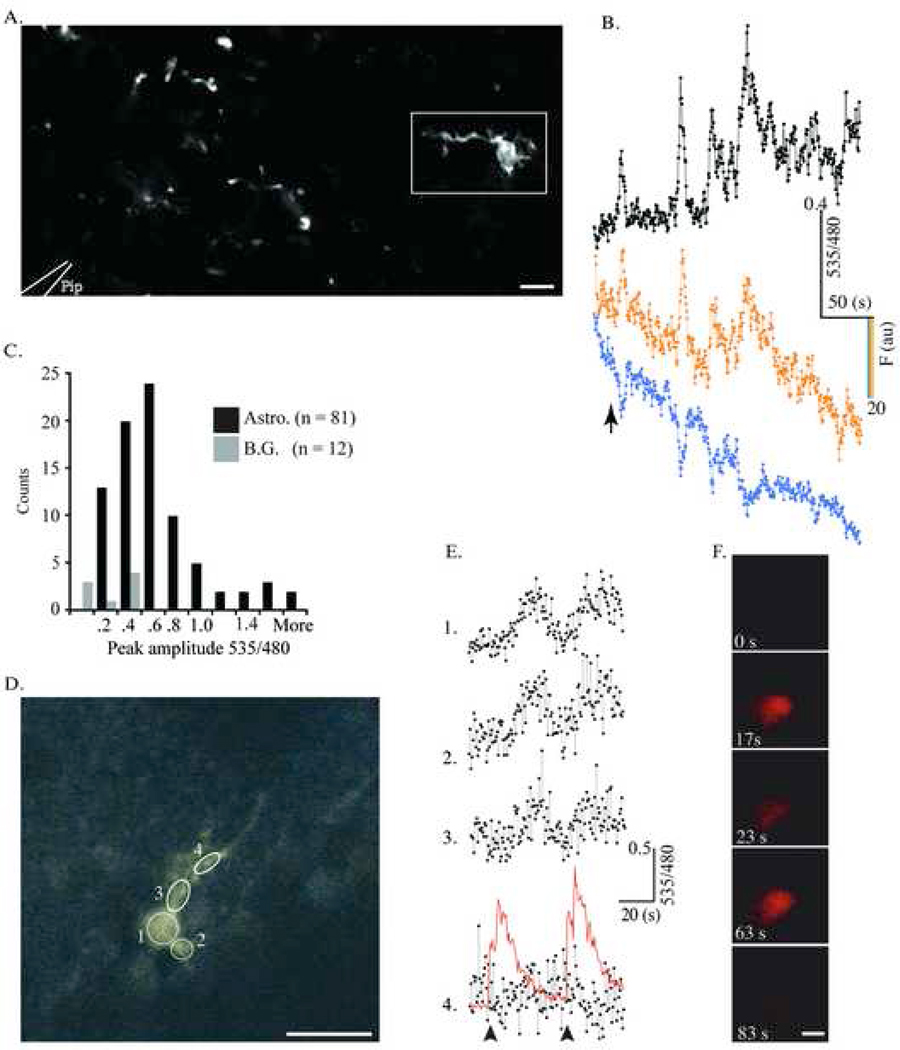
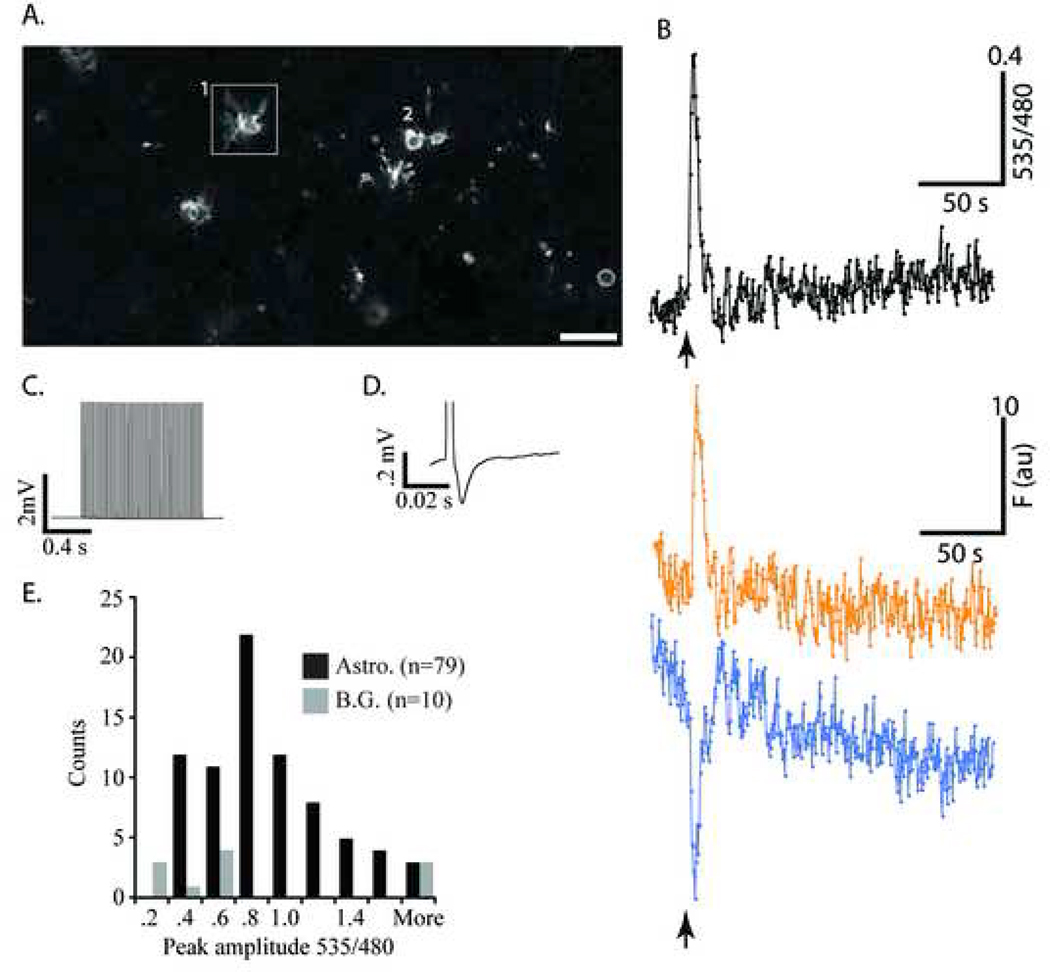
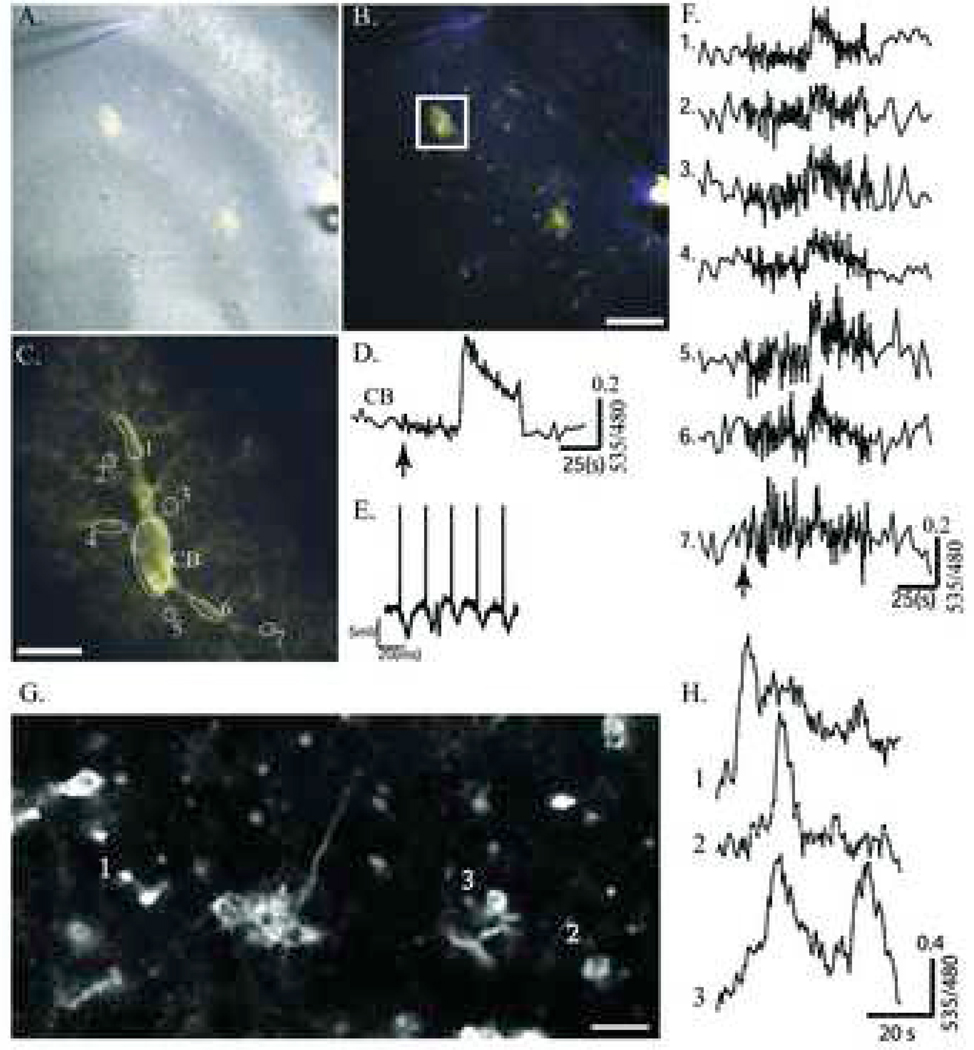
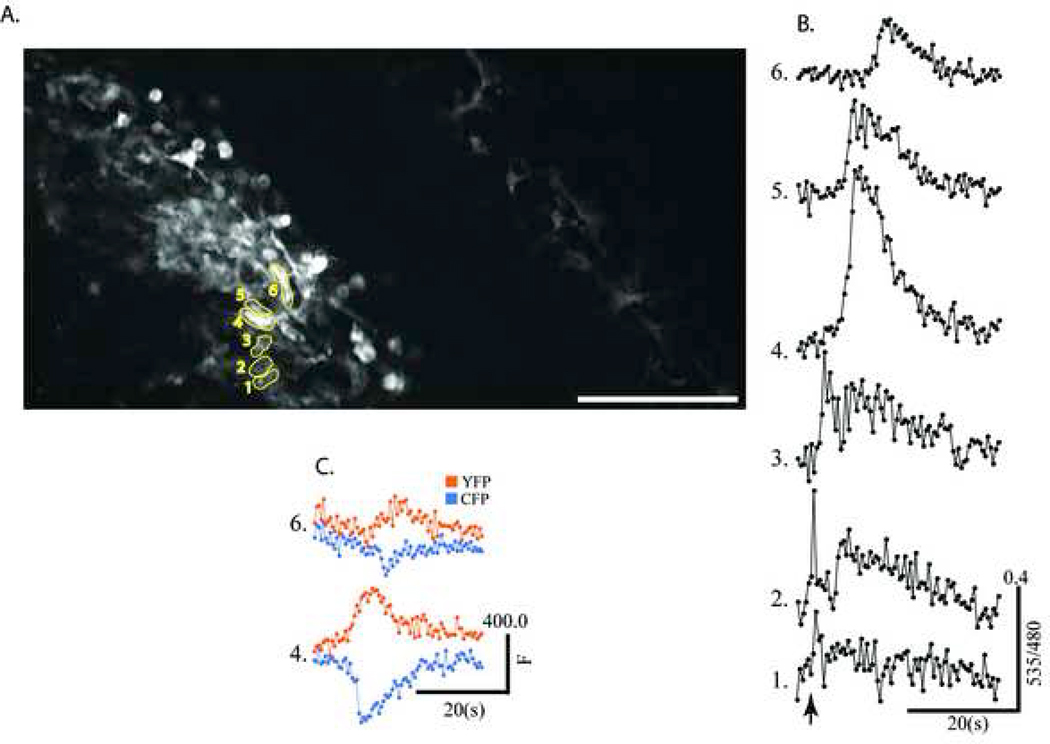
Glial cell Ca2+ signals play a key role in glial-neuronal and glial-glial network communication. Numerous studies have thus far utilized cell-permeant and injected Ca2+ indicator dyes to investigate glial Ca2+ signals in vitro and in situ. Genetically encoded fluorescent Ca2+ indicators have emerged as novel probes for investigating cellular Ca2+ signals. We have expressed one such indicator protein, the YC 3.60 cameleon, under the control of the S100beta promoter and directed its expression predominantly in astrocytes and Schwann cells. Expression of YC 3.60 extended into the entire cellular cytoplasmic compartment and the fine terminal processes of protoplasmic astrocytes and Schwann cell Cajal bands. In the brain, all the cells known to express S100beta in the adult or during development, expressed YC 3.60. While expression was most extensive in astrocytes, other glial cell types that express S100beta, such as NG2 and CNP-positive oligodendrocyte progenitor cells (OP cells), microglia, and some of the large motor neurons in the brain stem, also contained YC 3.60 fluorescence. Using a variety of known in situ and in vivo assays, we found that stimuli known to elicit Ca2+ signals in astrocytes caused substantial and rapid Ca2+ signals in the YC 3.60-expressing astrocytes. In addition, forepaw stimulation while imaging astrocytes through a cranial window in the somatosensory cortex in live mice, revealed robust evoked and spontaneous Ca2+ signals. These results, for the first time, show that genetically encoded reporter is capable of recording activity-dependent Ca2+ signals in the astrocyte processes, and networks.


Figures

Figure 1
Figure 1
Design of pS100β-YC 3.60 from previously derived vectors. A, S100β-EGFP(a1), pCMV-YC 3.60(a2), and the S100β-YC 3.60(a3) construct. Restriction enzyme sites are labeled. The NotI site 5' to YC 3.60 in a2 was mutated by PCR to an AgeI site for compatibility with the 3' end of the S100β promoter.
Figure 2
Figure 2
Expression of YC 3.60 in brain and peripheral nerves in transgenic F1 generation mice. Brains from 2 day old pups were fixed and sectioned in a cryostat as described in Methods and imaged without staining (A) or developed for immunohistochemistry using anti-GFP antibodies. A, A sagittal section from a S100β-YC-C mouse brain shows native YC 3.60 fluorescence imaged without staining (scale bar = 150 µm). B, Another section prepared as in A was developed for immunohistochemistry using anti-GFP antibodies and Rhodamine Red-X conjugated secondary antibodies (scale bar = 150 µm). Immunohistochemistry amplifies the signal compared with native YC 3.60 fluorescence. The transgenic mouse brain sections shows a large number of brightly stained cells that appear to be astrocytes, C, cerebellum; D; hippocampus, E; olfactory bulb (scale bars in C to E = 50 µm). F, Image of sciatic nerve from a S100β-YC-P mouse imaged intact through the perineureum shows myelinated axons brightly fluorescent with YC 3.60. The nerve was excited at 805 nm and YFP and CFP emissions were collected. Note intense YC 3.60 fluorescence in the Schwann cell soma (arrow), and Cajal bands (arrow head). The asterisk denotes a node of Ranvier (scale bar = 20 µm). G, Image of a section through the cortex from a S100β-YC-C mouse brain. Pial surface is at the top, and corpus callosum at the bottom (asterisk).
Figure 3
Figure 3
Immunohistochemical localization of YC 3.60 (red) and cell specific markers (green) in the adult S100β-YC-C hippocampus, and cerebellum. Arrowheads mark colocalization of anti-GFP staining with the cell specific marker, and arrows mark cells with non-overlapping stains. A, Widefield image of hippocampus dual stained with anti-GFP and anti-S100β antibodies. YC 3.60 staining overlaps with the majority of S100β positive cells (Scale bar = 200 µm). B, A maximum intensity projection of confocal slices of a single YC 3.60 and S100β positive astrocyte in the hippocampus (the green S100β stain has been turned off. Scale bar = 10 µm). C–E, Individual .8µm confocal slices from the hippocampus. YC 3.60 staining colocalizes (arrow heads) with S100β (astrocyte marker), and CNP (marker for oligodendrocyte lineage cells), but not NeuN, a neuronal marker. Note in C and D that cells stained for either S100β, CNP or YC 3.60 alone can be found (arrows). YC 3.60 was not found in myelin or in NeuN-positive neuronal cell bodies (Scale bar = 20 µm). F, Low magnification view of the cerebellum shows YC 3.60 and S100β colocalization in Bergmann glial cells. A number of S100β-containing astrocytes, however, show very low levels of YC 3.60 content. G, Maximum intensity projection of confocal slices from a S100β-positive Bergmann glial cell expressing YC 3.60 (S100β staining has been turned off. Scale bar = 20 µm). H–J, Individual 0.8µm confocal slices from a cerebellar section. Staining for YC 3.60 is found primarily in Bergmann glial cells (arrow head in H), very rarely in CNP-positive cells of the oligodendrocyte lineage (I), and not in NeuN-positive neurons (J, Scale bar = 20 µm).
Figure 4
Figure 4
YC 3.60 expression within the cortex, olfactory bulb, and brain stem. Immunohistochemistry of YC 3.60 (red) and cell markers (green); S100β (astrocytes), CNP (oligodendrocyte lineage cells), and NeuN (neurons) in a section from a S100β-YC-C mouse. All images are individual confocal (0.8µm) optical slices. Arrowheads mark overlapping stains, while arrows indicate non-colocalized stains. A–C, In the cortex, YC 3.60 is predominately found in S100β-positive astrocytes (arrowheads). Cells stained for either S100β or GFP alone are indicated. A few YC 3.60-positive cells in the corpus callosum (CC), and in Layer IV are CNP-positive. These cells are most likely oligodendrocytes (B). NeuN staining did not reveal any neurons expressing YC 3.60 (C). D–F, Olfactory cells expressing YC 3.60 are either S100β-positive astrocytes, or CNP-positive oligodendrocytes. NeuN staining did not colocalize with YC 3.60 positive cells. G–I, Staining in the brain stem revealed a pattern of S100β and CNP cell expression similar to that in the olfactory bulb. I, YC 3.60 was expressed in a number of the large motor neurons of the brain stem (Scale bar = 20 µm).
Figure 5
Figure 5
YC 3.60-expressing glia respond to glutamate in situ. A. YC 3.60-containing astrocytes in a cortical slice (S100β-YC-C mouse) were imaged in a Zeiss Upright two-Photon microscope using non-descanned detectors. A picospritzer ejected 100nL of 500µM glutamate from a 1 MΩ resistance pipette tip (represented by white outlines at bottom left. Scale bar = 50 µm). In this focal plane, only one cell is visible and the rest of the fluorescent profiles are parts of cells. Images (512×256 pixels) were acquired at 2Hz (1.6µs pixel dwell time). B, The change in 535/480 during glutamate ejection (arrow) for the cell within the rectangle in A (black trace, top). The traces in color (cyan and yellow) are single wavelength traces at 480 and 535 nm respectively. C, Frequency histogram of compiled data from all the experiments (81 cells, 9 slices) shows YFP/CFP ratio change from baseline levels to peak amplitude upon glutamate addition (R/R0). B.G. denotes background. DF, Cerebellar Bergmann glia were imaged and treated identically to the cortical astrocytes in A. Images (256×256 Pixels) were acquired at 2Hz (1.92 µs pixel dwell time). Circles delineate ROIs drawn over the cell where measurements were made (Scale bar = 20 µm). In this experiment, glutamate within the microinjection pipette was spiked with Quantum Dot 655 nanocrystals to allow direct visualization of the glutamate injection during imaging. E, YC 3.60 reports Ca2+ activity in ROIs 1–4 in D during two sequential glutamate injections. The arrow represents the 1st microinjection of 300µM glutamate, and the red trace represents the QD 655 fluorescence following injection in the ROI 4 trace. F. Time-lapse stills of the QD 655/Glutamate microinjection with time points labeled. The diameter of the QD cloud is roughly twice the diameter of the Bergmann glial cell body (Scale bar = 20 µm).
Figure 6
Figure 6
Ca2+ waves in astrocytes reported by YC 3.60 during electrical stimulation of Schaffer collateral pathway in a hippocampal slice. A, Astrocytes in the stratum radiatum of the S100β-YC-C mouse, approximately 200µm away from the extracellular stimulus electrode (Scale bar = 100 µm). Images (512×256 pixels) were acquired at 2 Hz (1.6 µs pixel dwell time). B, Ratio fluorescence (535/480 nm) trace from the astrocyte within the box in A. Arrow marks when a 1 second, 50Hz, 100 µA electrical pulse train was delivered to Schaffer collaterals (black trace, top). The traces in color at the bottom (cyan and yellow) represent single wavelength data at 535 nm and 480 nm respectively. Note that this astrocyte responded with an instantaneous Ca2+ response followed by low level oscillations. C, A trace of the 50Hz stimulus train and a single field potential recorded from the CA1 pyramidal dendrite layer D. E, Frequency histogram of the peak amplitude (R/R0) responses in astrocytes and background (B.G.) areas in the slice evoked by the stimulus protocol. Note that most astrocytes show a 20 to 70% increase in YFP/CFP ratio, and the background regions a 10 to 50% increase.
Figure 7
Figure 7
Ca2+ activity visualized in single astrocyte processes during hippocampus mossy fiber stimulation in the S100β-YC-B mouse. A, Overlay of bright field and transgenic YC 3.60 fluorescence in area CA3. The recording electrode can be seen in the upper left, and the stimulus electrode in the lower right of the pyramidal cell layer. B, Same as A without the bright field overlay (Scale bar = 100 µm). Images (512×512 pixels) were acquired at a rate of 1Hz (1.6 µs pixel dwell time). C, The cell bounded by the box in B was monitored at high magnification during mossy fiber stimulation (1s, at 50Hz, 100µA). D, YFP/CFP ratio trace from the cell body (CB). E, Field potentials recorded in response to the first 5 stimuli in the stimulus train. F, Traces 1 to 7 show YFP/CFP ratios measured in the ROIs 1 to 7 (numbered in C). Stimulus occurs at the arrow. G, A two-photon image from Stratum Oriens near the CA1 pyramidal cell layer shows spontaneous Ca2+ activity (Scale bar = 10 µm). Images (512×256 pixels) were acquired at 2Hz (1.6µs pixel dwell time). H, Ratio fluorescence (535/480 nm) traces obtained from three individual cells are plotted to show asynchronous spontaneous activity.
Figure 8
Figure 8
In vivo recordings of astrocytic Ca2+ signals. YC 3.60-containing astrocytes in layer 2/3 cortex were imaged by 2-photon microscopy through a cranial window in an anaesthetized live mouse from the S100β-YC-C line. Only one or two fields can be imaged through the 3 mm window, but imaging extended as far as 250 µm deep within the cortex (see also Supplementary Figures 5 and 6). Images (512×256 pixels) were acquired at a rate of 2Hz, (1.6 µs pixel dwell time). While imaging, the forepaw of the mouse was stimulated using small (27 gauge) needle electrodes for 3 s (50 Hz, 1.5 mA, 100 µs, pulses, arrow in B). A, Glial cells (putative astrocytes) containing YC 3.60 fluorescence in the field (Scale = 100 µm). Note also labeled cells away from focal plane on the right side of the field. B, Traces showing 535/475 ratio plotted against time. Traces represent data derived from the cells outlined and numbered in panel A. Note the astrocytic Ca2+ response begins at the bottom of the field and spreads as a wave upwards. C, Single wavelength fluorescence intensity data (CFP, Blue, and YFP, Yellow) derived from cells numbered 4 and 6 in A.

Similar articles

Cited by

References

    1. Araque A, Parpura V, Sanzgiri RP, Haydon PG. Glutamate-dependent astrocyte modulation of synaptic transmission between cultured hippocampal neurons. Eur J Neurosci. 1998;10:2129–2142. - PubMed
    1. Bushong EA, Martone ME, Ellisman MH. Examination of the relationship between astrocyte morphology and laminar boundaries in the molecular layer of adult dentate gyrus. J Comp Neurol. 2003;462:241–251. - PubMed
    1. Bushong EA, Martone ME, Jones YZ, Ellisman MH. Protoplasmic astrocytes in CA1 stratum radiatum occupy separate anatomical domains. J Neurosci. 2002;22:183–192. - PMC - PubMed
    1. Dani JW, Chernjavsky A, Smith SJ. Neuronal activity triggers calcium waves in hippocampal astrocyte networks. Neuron. 1992;8:429–440. - PubMed
    1. Diez-Garcia J, Matsushita S, Mutoh H, Nakai J, Ohkura M, Yokoyama J, Dimitrov D, Knopfel T. Activation of cerebellar parallel fibers monitored in transgenic mice expressing a fluorescent Ca2+ indicator protein. Eur J Neurosci. 2005;22:627–635. - PubMed

Publication types

MeSH terms

LinkOut - more resources