. 2009 Jul 9;38(2):125-37.
doi: 10.1152/physiolgenomics.00033.2009. Epub 2009 May 19.

Transcriptomic and proteomic analysis of global ischemia and cardioprotection in the rabbit heart

Affiliations

Transcriptomic and proteomic analysis of global ischemia and cardioprotection in the rabbit heart

James D McCully et al. Physiol Genomics. .

Abstract

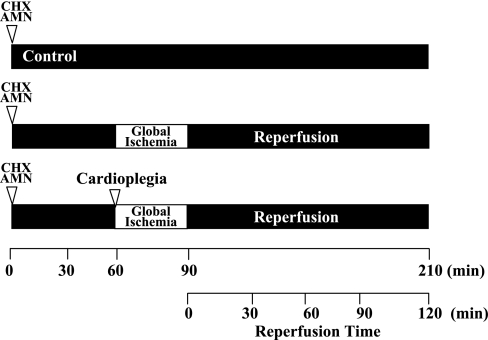
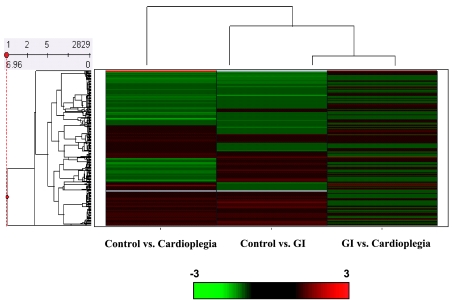
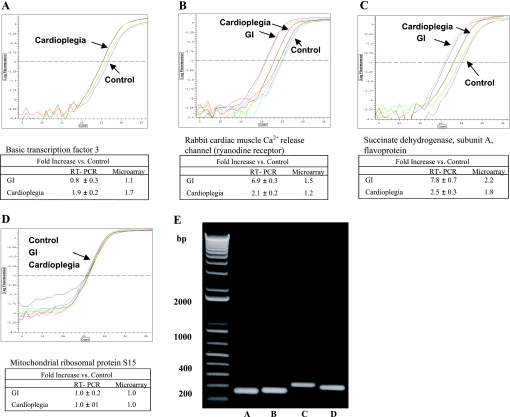
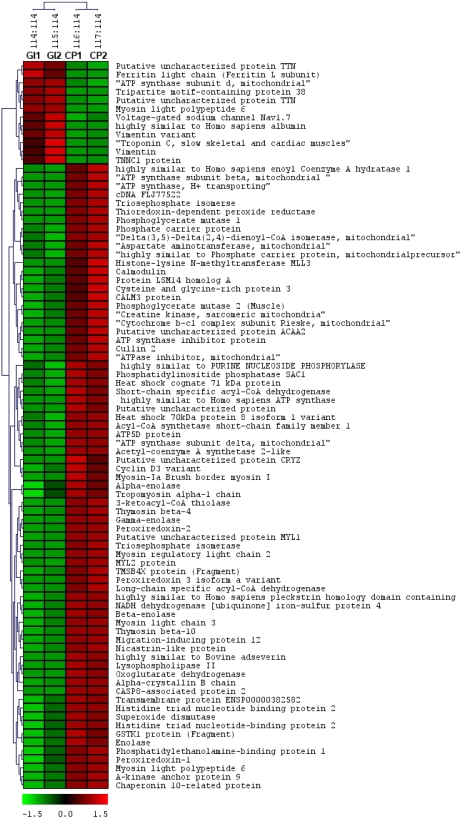
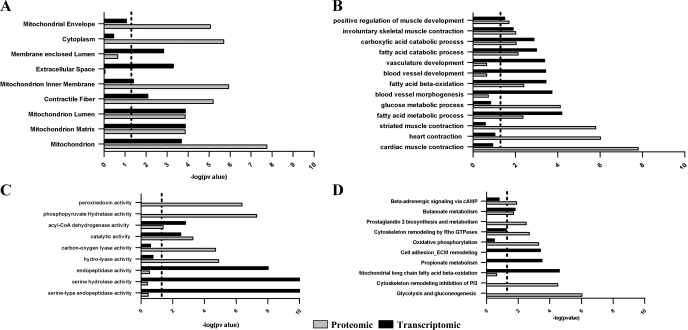
Cardioplegia is used to partially alleviate the effects of surgically induced global ischemia injury; however, the molecular mechanisms involved in this cardioprotection remain to be elucidated. To improve the understanding of the molecular processes modulating the effects of global ischemia and the cardioprotection afforded by cardioplegia, we constructed rabbit heart cDNA libraries and isolated, sequenced, and identified a compendium of nonredundant cDNAs for use in transcriptomic and proteomic analyses. New Zealand White rabbits were used to compare the effects of global ischemia and cardioplegia compared with control (nonischemic) hearts. The effects of RNA and protein synthesis on the cardioprotection afforded by cardioplegia were investigated separately by preperfusion with either alpha-amanitin or cycloheximide. Our results demonstrate that cardioplegia partially ameliorates the effects of global ischemia and that the cardioprotection is modulated by RNA- and protein-dependent mechanisms. Transcriptomic and proteomic enrichment analyses indicated that global ischemia downregulated genes/proteins associated with mitochondrial function and energy production, cofactor catabolism, and the generation of precursor metabolites of energy. In contrast, cardioplegia significantly increased differentially expressed genes/proteins associated with the mitochondrion and mitochondrial function and significantly upregulated the biological processes of muscle contraction, involuntary muscle contraction, carboxylic acid and fatty acid catabolic processes, fatty acid beta-oxidation, and fatty acid metabolic processes.


Figures

Fig. 1.
Fig. 1.
Experimental protocol. All experiments consisted of 60 min of equilibrium followed by 30 min of global ischemia (GI) and 120 min of reperfusion. Control hearts were perfused without GI at 37°C for 210 min. GI hearts were subjected to 30 min of GI and 120 min of reperfusion. Cardioplegia (CP) hearts received magnesium-supplemented potassium CP solution containing diazoxide (50 μM) for 5 min before GI and 120 min of reperfusion. To determine the role of RNA or protein synthesis in the cardioprotection afforded by CP, a separate group of control and CP hearts was preperfused for 55 min with Krebs-Ringer solution containing either α-amanitin (AMN; 2.5 μg/ml) to inhibit RNA synthesis or cycloheximide (CHX; 50 μg/ml) to inhibit protein synthesis. Control + AMN and control + CHX hearts were then perfused for a further 155 min. CP + AMN and CP + CHX hearts received CP for 5 min before 30 min of GI and 120 min of reperfusion.
Fig. 2.
Fig. 2.
Right: hierarchical cluster analysis for CI and GI compared with control to account for constitutively expressed RNAs and CP versus GI to show RNAs up- and downregulated in CP compared with GI. Dendograms are shown on the left, with a scale bar. Cluster numbers for control versus CP are shown on the left. The red color indicates upregulated RNAs, and the green color indicates downregulated RNAs.
Fig. 3.
Fig. 3.
Representative real-time RT-PCR analysis of transcripts up- and downregulated in cDNA microarray analysis. Real-time RT-PCR graphs are shown for the following: basic transcription factor 3 (A); rabbit cardiac muscle Ca2+ release channel (the ryanodine receptor; B); succinate dehydrogenase, subunit A, flavoprotein (C); and mitochondrial ribosomal protein S15 (D), which was used as a control gene. All results are shown as means ± SE for 6 assays each. Real-time RT-PCR levels tended to be increased compared with microarray results. E: real-time RT-PCR products for the transcripts in A–D (lanes A–D, respectively) were confirmed by gel electrophoresis and by sequence analysis (results not shown).
Fig. 4.
Fig. 4.
Hierarchical cluster analysis for proteins having >1.4-fold change between CP and GI. The proteins are identified with short descriptions obtained from the SWISS-PROT database. Protein expression is shown with a pseudocolor scale (from −3 to 3) with the red color indicating a high expression level and the green color indicating low expression in CP compared with GI.
Fig. 5.
Fig. 5.
Direct comparison of microarray and proteomic data. A: Venn diagrams for the direct comparison of microarray and proteomic data. Ten proteins were common between differentially expressed (DEF) transcriptomic and proteomic data, of which three proteins were significantly differentially expressed in the proteomic data. B: expression changes for the three proteins. CSRP3, cysteine- and glycine-rich protein 3; TNNC1, troponin C; ACADL, acyl-CoA dehydrogenase. TNNC1 was compared using two different probes (OB1 and OB2) in the transcriptomic data.
Fig. 6.
Fig. 6.
A: representative real-time RT-PCR analysis of CSRP3. B: fold changes for CSRP3 compared with the control. C: representative Western blot for CSRP3. Molecular masses (in kDa) are shown. D: densimetric analysis for n = 3 blots. Significant differences between groups, determined by one-way ANOVA, are shown in bold type.
Fig. 7.
Fig. 7.
Gene ontology (GO)-based comparison of microarray and proteomic data. A: GO cellular components; B: GO biological processes; C: GO metabolic functions; and D: GO canonical pathways. Proteomics data are shown by the shaded bars; transcriptomic data are shown by the solid bars. The dotted lines in A–D show the significance threshold (P < 0.05). P values were calculated using the MetaCore Tool in the GeneGO package (http://www.genego.com/).

References

    1. Altman N Replication, variation and normalization in microarray experiments. Appl Bioinformatics 4: 33–44, 2005. - PubMed
    1. Barth AS, Merk S, Arnoldi E, Zwermann L, Kloos P, Gebauer M, Steinmeyer K, Bleich M, Kääb S, Pfeufer A, Uberfuhr P, Dugas M, Steinbeck G, Nabauer M. Functional profiling of human atrial and ventricular gene expression. Pflügers Arch 50: 201–208, 2005. - PubMed
    1. Cardin S, Pelletier P, Libby E, Le Bouter S, Xiao L, Kääb S, Demolombe S, Glass L, Nattel S. Marked differences between atrial and ventricular gene-expression remodeling in dogs with experimental heart failure. J Mol Cell Cardiol 45: 821–831, 2008. - PubMed
    1. Crozier SJ, Bolster DR, Reiter AK, Kimball SR, Jefferson LS. β-Oxidation of free fatty acids is required to maintain translational control of protein synthesis in the heart. Am J Physiol Endocrinol Metab 283: E1144–E1150, 2002. - PubMed
    1. Eddy LJ, Stewart JR, Jones HP, Engerson TD, McCord JM, Downey JM. Free radical-producing enzyme, xanthine oxidase, is undetectable in human hearts. Am J Physiol Heart Circ Physiol 253: H709–H711, 1987. - PubMed

Publication types

MeSH terms