. 2009 May;21(5):1453-72.
doi: 10.1105/tpc.108.062935. Epub 2009 May 19.

Gibberellin modulates anther development in rice via the transcriptional regulation of GAMYB

Affiliations

Gibberellin modulates anther development in rice via the transcriptional regulation of GAMYB

Koichiro Aya et al. Plant Cell. 2009 May.

Abstract

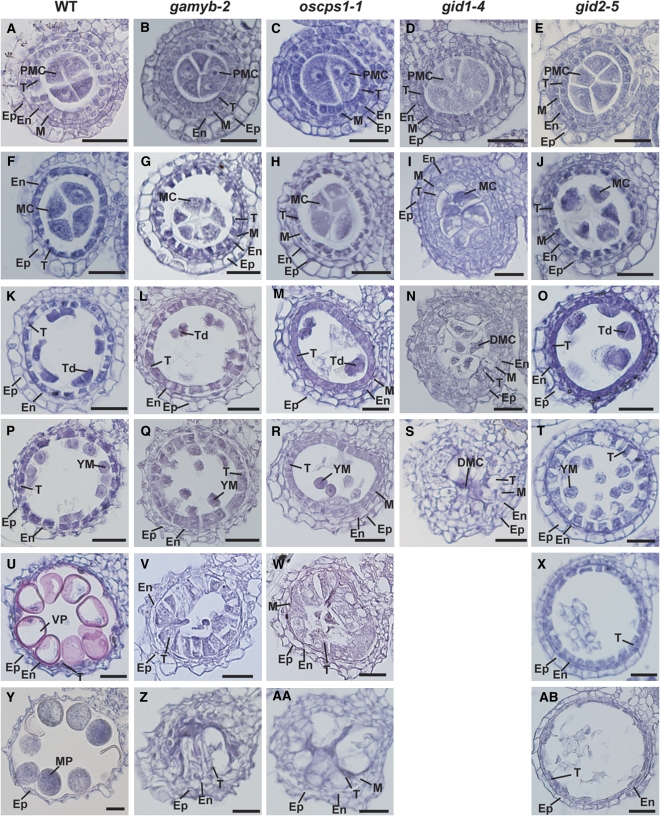
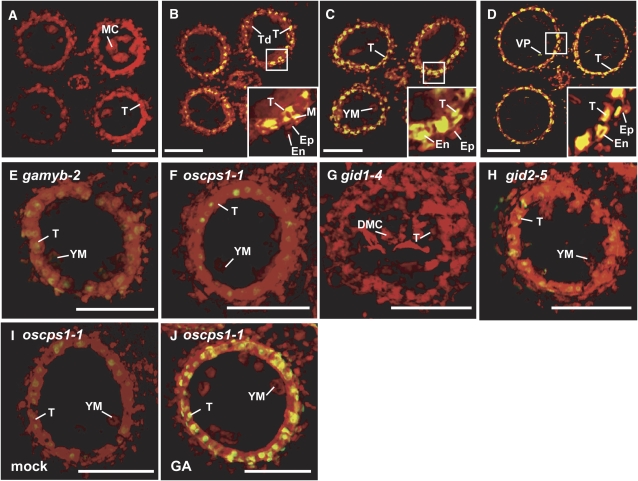
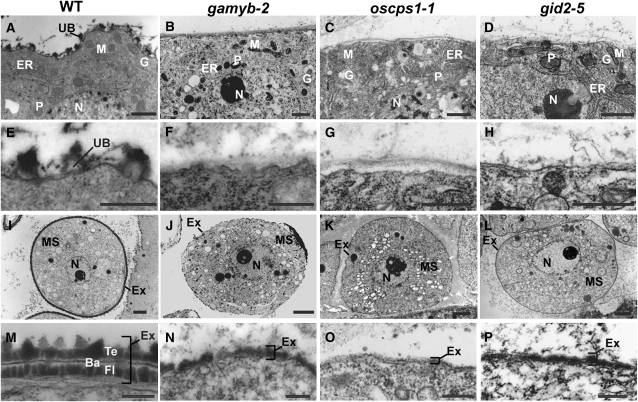
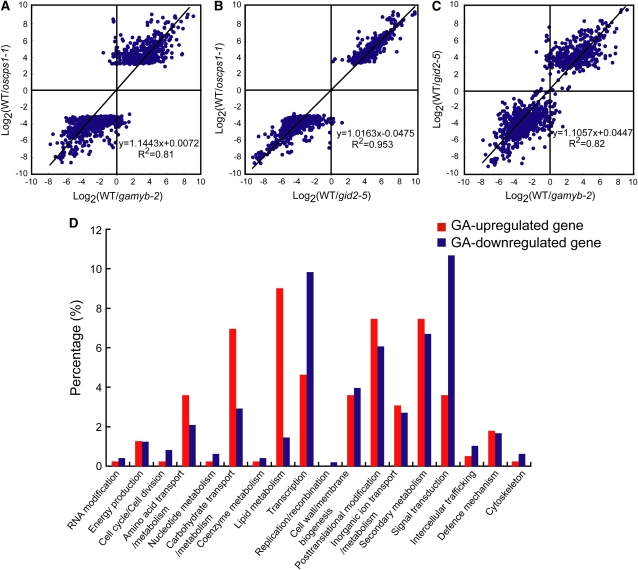
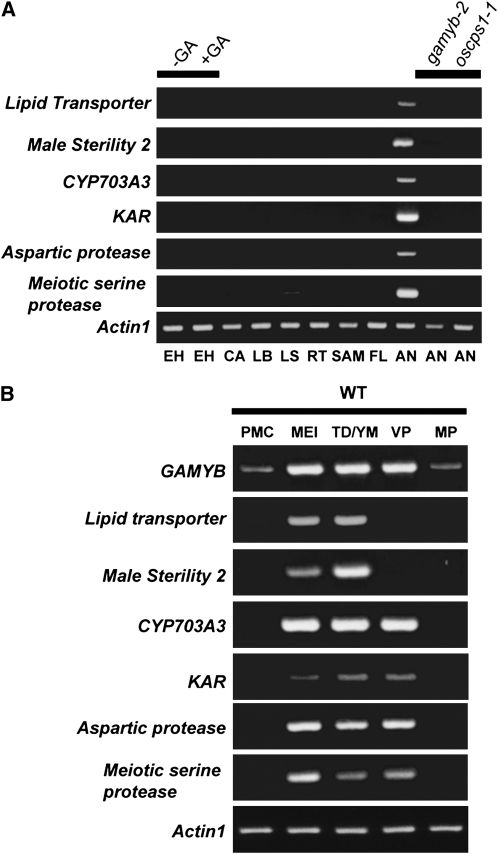
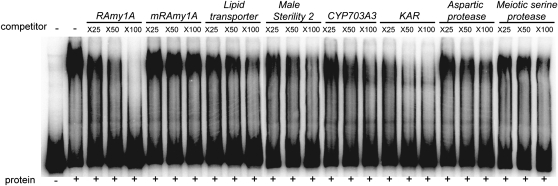
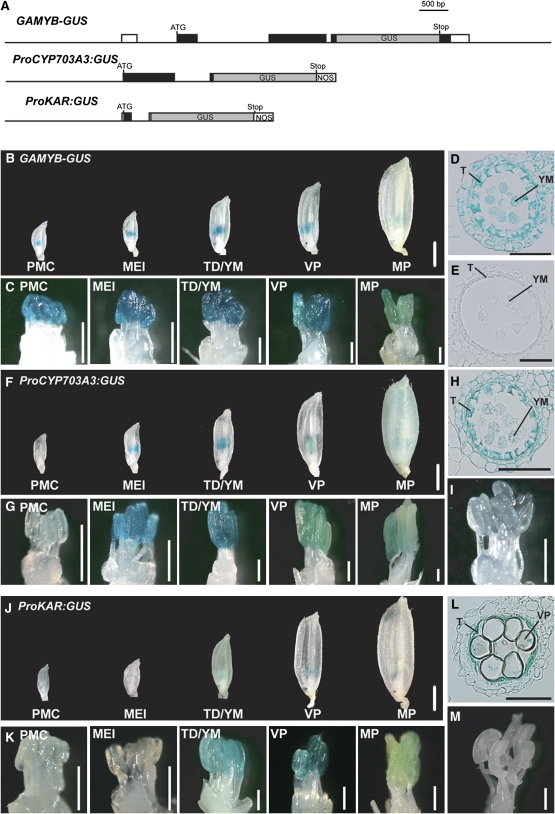
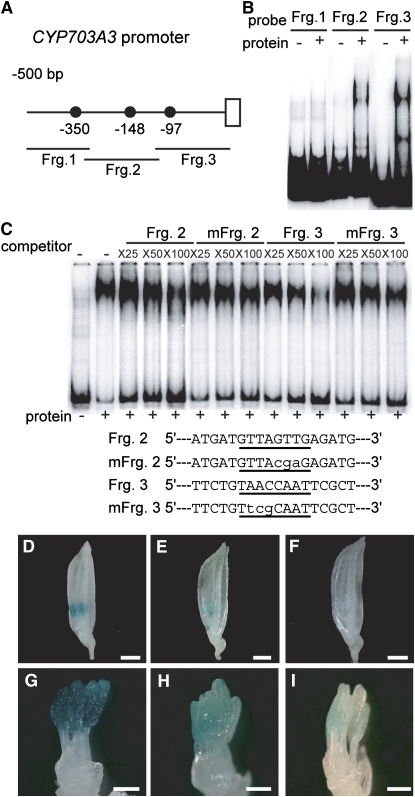
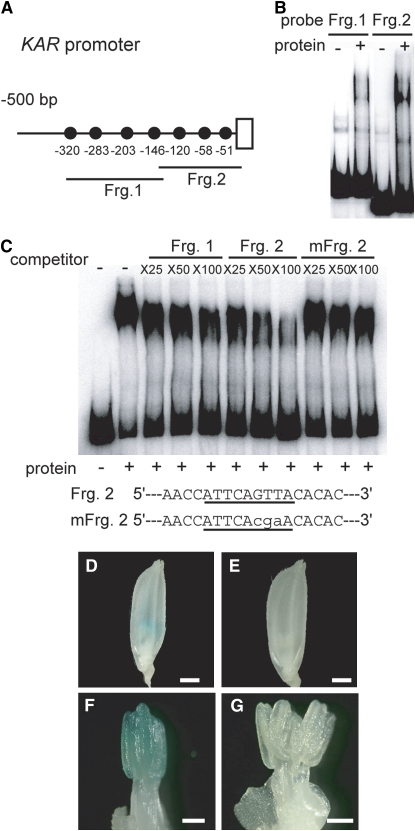
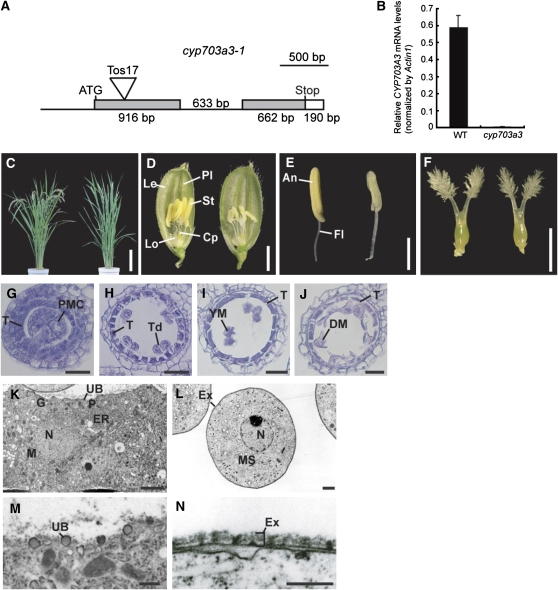
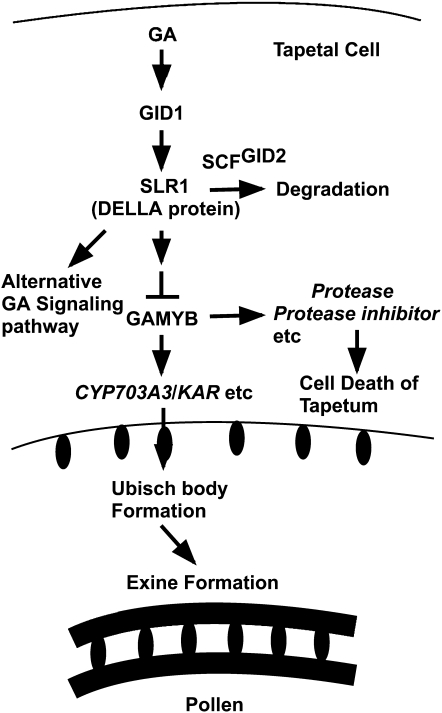
Gibberellins (GAs) play important roles in regulating reproductive development, especially anther development. Our previous studies revealed that the MYB transcriptional factor GAMYB, an important component of GA signaling in cereal aleurone cells, is also important for anther development. Here, we examined the physiological functions of GA during anther development through phenotypic analyses of rice (Oryza sativa) GA-deficient, GA-insensitive, and gamyb mutants. The mutants exhibited common defects in programmed cell death (PCD) of tapetal cells and formation of exine and Ubisch bodies. Microarray analysis using anther RNAs of these mutants revealed that rice GAMYB is involved in almost all instances of GA-regulated gene expression in anthers. Among the GA-regulated genes, we focused on two lipid metabolic genes, a cytochrome P450 hydroxylase CYP703A3 and beta-ketoacyl reductase, both of which might be involved in providing a substrate for exine and Ubisch body. GAMYB specifically interacted with GAMYB binding motifs in the promoter regions in vitro, and mutation of these motifs in promoter-beta-glucuronidase (GUS) transformants caused reduced GUS expression in anthers. Furthermore, a knockout mutant for CYP703A3 showed gamyb-like defects in exine and Ubisch body formation. Together, these results suggest that GA regulates exine formation and the PCD of tapetal cells and that direct activation of CYP703A3 by GAMYB is key to exine formation.


Figures

Figure 1.
Figure 1.
Histological Analysis of Anther Development in Wild-Type and GA-Related Mutants. Anther development in wild-type and GA-related mutants was compared at the six different stages: PMC, MEI, TD, YM, VP, and MP. Ep, epidermal cell layer; En, endothecial cell layer; M, middle layer; T, tapetal layer; MC, meiocyte; DMC, degraded meiocyte; Td, tetrad. Bars = 25 μm. (A) to (E) Transverse sections of anthers at the PMC stage in the wild type (A), gamyb-2 (B), oscps1-1 (C), gid1-4 (D), and gid2-5 (E). (F) to (J) Transverse sections of anthers at the MEI stage in wild type (F), gamyb-2 (G), oscps1-1 (H), gid1-4 (I), and gid2-5 (J). (K) to (O) Transverse sections of anthers at the TD stage in the wild type (K), gamyb-2 (L), oscps1-1 (M), gid1-4 (N), and gid2-5 (O). (P) to (T) Transverse sections of anthers at the YM stage in the wild type (P), gamyb-2 (Q), oscps1-1 (R), gid1-4 (S), and gid2-5 (T). (U) to (X) Transverse sections of anthers at the VP stage in the wild type (U), gamyb-2 (V), oscps1-1 (W), and gid2-5 (X). (Y) to (AB) Transverse sections of anthers at the MP stage in the wild type (Y), gamyb-2 (Z), oscps1-1 (AA), and gid2-5 (AB).
Figure 2.
Figure 2.
TUNEL Assay of Anthers in Wild-Type and GA-Related Mutants. (A) MEI stage in the wild type. (B) TD stage in the wild type. (C) and (E) to (H) YM stage in the wild type (C), gamyb-2 (E), oscps1-1 (F), gid1-4 (G), and gid2-5 (H). (D) VP stage in the wild type. (I) Mock-treated anther at the YM stage in oscps1-1. (J) GA3-treated anther at the YM stage in oscps1-1. The box in each panel outlines the portion of the anther cell layers shown at higher magnification in the inset. Nuclei were stained with propidium iodide (red), while yellow fluorescence is a TUNEL-positive signal. Ep, epidermal cell layer; En, endothecial cell layer; M, middle layer; T, tapetal layer; MC, meiocyte; DMC, degraded meiocyte; Td, tetrad. Bars = 50 μm.
Figure 3.
Figure 3.
Ultrastructural Analysis of Ubisch Bodies and Exine in Wild-Type and GA-Related Mutants by TEM. (A) to (D) The cytoplasm of tapetal cells in the wild type (A), gamyb-2 (B), oscps1-1 (C), and gid2-5 (D). N, nucleus; P, plastid; M, mitochondria; ER, endoplasmic reticulum; G, Golgi body; UB, Ubisch body. Bars = 1 μm. (E) to (H) The plasma membrane of tapetal cells in the wild type (E), gamyb-2 (F), oscps1-1 (G), and gid2-5 (H). Bars = 500 nm. (I) to (L) The cytoplasm of microspores in the wild type (I), gamyb-2 (J), oscps1-1 (K), and gid2-5 (L). MS, microspore; N, nucleus; Ex, exine. Bars = 2 μm. (M) to (P) Microspore coat of the wild type (M), gamyb-2 (N), oscps1-1 (O), and gid2-5 (P). Ba, bacula; Te, tectum; Fl, foot layer. Bars = 250 nm.
Figure 4.
Figure 4.
Microarray Analysis of Genes Regulated by GA, GAMYB, and GID2. Axes show the log2 value of the ratios of signal intensities observed in the indicated plants. Each spot represents one probe. (A) Scatterplot analysis to compare the expression of genes regulated by GA (oscps1-1 background) and GAMYB in the anther. (B) Scatterplot analysis to compare the expression of genes regulated by GA (oscps1-1 background) and GID2 in the anther. (C) Scatterplot analysis to compare the expression of genes regulated by GAMYB and GID2 in the anther. (D) Functional classification of GA-regulated genes identified by the comparison of genes differentially expressed between the wild type and oscps1-1.
Figure 5.
Figure 5.
Expression Analysis of GA-Regulated Genes during Anther Development. (A) Spatial expression of GA-regulated genes in various tissues by RT-PCR analysis. EH, embryoless half-seed; CA, callus; LB, leaf blade; LS, leaf sheath; RT, root; VM, vegetative meristem; FL, mature flower (lemma > 8 mm); AN, anther; SAM, shoot apical meristem. Embryoless half-seeds were treated with (+) or without (–) 10−5 M GA3 for 3 d. Rice Actin1 was used as a control. Results presented are representative of three independent experiments. (B) Temporal expression of GA-regulated genes in developing anthers at five stages of anther development by RT-PCR analysis. Each developmental stage was scored according to the length of the lemma: PMC stage (lemma 2 mm), MEI stage (2 to 3 mm), TD/YM stage (3 to 5 mm), VP stage (5 to 8 mm), and MP stage (> 8 mm). Rice Actin1 was used as a control. Results presented are representative of three independent experiments.
Figure 6.
Figure 6.
Competitive Gel-Shift Assay. DNA fragments containing the GAMYB binding-like motifs of six GA-upregulated genes inhibited the interaction between GAMYB and the 32P-labeled RAmy1A probe (−380 to −85). Competition experiments were performed using increasing molar amounts (×25, ×50, and ×100) of the indicated unlabeled fragment; lanes 3 to 5, RAmy1A (−380 to −85); lanes 6 to 8, mutated RAmy1A (mRAmy1A) (−380 to −85); lanes 9 to 11, Lipid transporter (−501 to −250); lanes 12 to 14, Male Sterility 2 (−425 to −123); lanes 15 to 17, CYP703A3 (−510 to +40); lanes 18 to 20, KAR (−332 to −4); Lanes 21 to 23, Aspartic protease (−495 to −126); and Lanes 24 to 26, Meiotic serine protease (−397 to −142). Numbers in parentheses indicate the distance in base pairs from the transcriptional initiation site.
Figure 7.
Figure 7.
GUS Expression under the Control of the Promoters of GAMYB, CYP703A3, and KAR during Anther Development. (A) Schematic representation of the GAMYB-GUS, ProCYP703A3:GUS, and ProKAR:GUS constructs. Untranscribed regions and introns are shown as thin lines, untranslated regions as open boxes, and coding regions as closed boxes. GUS reporter regions are indicated in gray boxes. ATG, ATG start codon; Stop, stop codon; NOS, nos terminator. (B) to (D) GUS expression of GAMYB-GUS (line #5) in the wild type. We analyzed 13 T0-independent lines. (B) Whole flowers at each developmental stage. Bar = 1 mm. (C) Close-up view of stamens. Bars = 400 μm. (D) Cross section of anther at the TD/YM stage. Bar = 50 μm. (E) Anther cross section of a transgenic line at the TD/YM stage carrying the vector control. Bar = 50 μm. (F) to (H) GUS expression of ProCYP703A3:GUS in the wild type (line #4). We analyzed 10 T0-independent lines. (F) Whole flowers at each developmental stage. Bar = 1 mm. (G) Close-up view of stamens. Bars = 400 μm. (H) Cross section of an anther at the TD/YM stage. Bar = 50 μm. (I) GUS expression of ProCYP703A3:GUS in gamyb-2 (line #3). Bar = 400 μm. We analyzed 12 T0-independent lines. (J) to (L) GUS expression of ProKAR:GUS in the wild type (line #7). We analyzed 10 T0-independent lines. (J) Whole flowers at each developmental stage. Bar = 1 mm. (K) Close-up view of stamens. Bars = 400 μm. (L) Cross section of an anther at the VP stage. Bar = 50 μm. (M) GUS expression of ProKAR:GUS in gamyb-2 (line #2). We analyzed 13 T0-independent lines. Bar = 400 μm. T, tapetal layer; YM, young microspore; VP, vacuolated pollen.
Figure 8.
Figure 8.
In Vivo Function of GAMYB Binding-Like Motifs in CYP703A3. (A) Schematic representation of the 5′-flanking region of CYP703A3. The closed circles show GAMYB binding-like motifs. Fragments 1, 2, and 3 (Frg. 1, bp −510 to −308; Frg. 2, bp −328 to −112; Frg. 3, bp −131 to +40) were used as probes or competitors for gel-shift assays in (B) and (C). (B) Gel-shift assay with the recombinant GAMYB protein and 32P-labeled Frg. 1 to 3 presented in (A). (C) Competitive gel-shift assay. The interaction between GAMYB and 32P-labeled RAmy1A probe was efficiently competed by Fragment 3 but not by Fragment 2, whereas mutagenized Fragment 2 or 3 (mFrg. 2 and 3), which contain displaced nucleotides at the GAMYB binding site, did not show effective competitive activity. Competition experiments were performed using increasing molar amounts (×25, ×50, and ×100) of the indicated unlabeled fragment. The sequences of the oligonucleotides used as competitor fragments are shown at the bottom of the panel. The putative binding site is underlined, and the mutations are indicated in lowercase letters. (D) to (F) Whole flowers at the TD/YM stage. Bars = 1 mm. (G) to (I) Close-up view of stamens at the TD/YM stage. Bars = 300 μm. (D) and (G) Flower from a plant transformed with the intact ProCYP703A3:GUS construct (line #6). (E) and (H) Flower from a plant transformed with the mutagenized ProCYP703A3 (mFrg. 2):GUS construct (line #12). (F) and (I) Flower from a plant transformed with the mutagenized ProCYP703A3 construct (mFrg. 3):GUS (line #9). We analyzed 10 T0-independent lines for ProCYP703A3:GUS, 12 lines for mFrg. 2, and 18 lines for mFrg. 3.
Figure 9.
Figure 9.
In Vivo Function of a GAMYB Binding-Like Motif in KAR. (A) Schematic representation of the 5′-flanking region of KAR. The closed circles show GAMYB binding-like motifs. Fragments 1 and 2 (Frg. 1, bp −332 to −123; Frg. 2, bp −143 to −4) were used as probes or competitors for gel-shift assays in (B) and (C), respectively. (B) Gel-shift assay with the recombinant GAMYB protein and 32P-labeled Fragments 1 and 2 presented in (A). (C) Competitive gel-shift assay. The interaction between GAMYB and 32P-labeled RAmy1A probe was efficiently competed by Fragment 2 but not by Fragment 1, whereas mutagenized Fragment 2 (mFrg. 2), which contains displaced nucleotides at the GAMYB binding-like motif, did not show effective competitive activity. Competition experiments were performed using increasing molar amounts (×25, ×50, and ×100) of the indicated unlabeled fragment. The sequences of the oligonucleotides used as Frg. 2 and mFrg.2 are shown at the bottom of the panel. The putative binding site is underlined, and the mutations are indicated in lowercase letters. (D) and (E) Whole flowers at the VP stage. Bars = 1 mm. (F) and (G) Close-up view of stamens at the VP stage. Bars = 300 μm. (D) and (F) Flower transformed with the intact ProKAR:GUS (line #8). (E) and (G) Flower transformed with the mutagenized ProKAR (mFrg. 2):GUS (line #12). We analyzed 10 T0-independent lines for ProKAR:GUS and 12 lines for mFrg. 2.
Figure 10.
Figure 10.
Characterization of a Loss-of-Function Mutant of CYP703A3. (A) Site of Tos17 insertion in the CYP703A3 gene. Untranscribed and intron regions are represented as lines. Coding and untranslated regions are represented as gray and open boxes, respectively. The insertion site of Tos17 is indicated as a triangle. Bar = 500 bp. (B) Quantitative RT-PCR analysis of CYP703A3 in flowers. Total RNA was extracted from wild-type and cyp703a3-1 flowers. The transcript was assayed by real-time PCR relative to an internal Actin1 control. Data are means ± sd from three replicates. (C) Gross morphology of the wild type (left) and the cyp703a3-1 mutant (right) at the ripening stage. Bar = 20 cm. (D) Flowers of the wild type (left) and cyp703a3-1 (right). Cp, carpel; Le, lemma; Lo, lodicule; Pl, palea; St, stamen. Bar = 2 mm. (E) Stamens of the wild type (left) and cyp703a3-1 (right). An, anther; Fl, filament. Bar = 1 mm. (F) Pistils of the wild type (left) and cyp703a3-1 (right). Bar = 1 mm. (G) to (J) Transverse sections of cyp703a3-1 anthers at the PMC stage (G), TD stage (H), YM stage (I), and MP stage (J). T, tapetal layer; Td, tetrad; DM, degraded microspore. Bars = 25 μm. (K) to (N) Ultrastructural analysis of cyp703a3-1 anthers by TEM. (K) The cytoplasm of tapetal cell in cyp703a3-1. N, nucleus; P, plastid; M, mitochondria; ER, endoplasmic reticulum; G, Golgi body; UB, Ubisch body. Bar = 1 μm. (L) The cytoplasm of a cyp703a3-1 microspore. MS, microspore; N, nucleus; Ex, exine. Bar = 2 μm. (M) Defective Ubisch body on the plasma membrane of tapetal cells in cyp703a3-1. Bar = 500 nm. (N) Defective exine on the microspore coat in cyp703a3-1. Bar = 250 nm.
Figure 11.
Figure 11.
Model for GA Signaling in the Anther. GA signaling predominantly works in tapetal cells through perception by the GID1/DELLA (SLR1) system that leads to degradation of DELLA protein by SCFGID2 proteasome pathway and downstream action of GAMYB. GAMYB activates the expression of CYP703A3, KAR, and other genes involved in the synthesis of sporopollenin, which is an essential component of the Ubisch body in the tapetal cell and exine in the pollen coat and also activates some GA-upregulated genes, such as Protease and Protease inhibitor that are probably involved in cell death of tapetal cells. See text for details.

References

    1. Achard, P., Herr, A., Baulcombe, D.C., and Harberd, N.P. (2004). Modulation of floral development by a gibberellin-regulated microRNA. Development 131 3357–3365. - PubMed
    1. Ahlers, F., Bubert, H., Steuernagel, S., and Wiermann, R. (2000). The nature of oxygen in sporopollenin from the pollen of Typha angustifolia L. Z. Naturforsch. [C] 55 129–136. - PubMed
    1. Ahlers, F., Thom, I., Lambert, J., Kuckuk, R., and Wiermann, R. (1999). 1H NMR analysis of sporopollenin from Typha angustifolia. Phytochemistry 50 1095–1098.
    1. Ariizumi, T., Murase, K., Sun, T.-P., and Steber, C.M. (2008). Proteolysis-independent downregulation of DELLA repression in Arabidopsis by the gibberellin receptor GIBBERELLIN INSENSITIVE DWARF1. Plant Cell 20 2447–2459. - PMC - PubMed
    1. Bagnall, D.J. (1992). Control of flowering in Arabidopsis thaliana by light, vernalisation and gibberellins. Aust. J. Plant Physiol. 19 401–409.

Publication types

MeSH terms