. 2009:5:272.
doi: 10.1038/msb.2009.30. Epub 2009 May 19.

Protein sequestration generates a flexible ultrasensitive response in a genetic network

Affiliations

Protein sequestration generates a flexible ultrasensitive response in a genetic network

Nicolas E Buchler et al. Mol Syst Biol. 2009.

Abstract

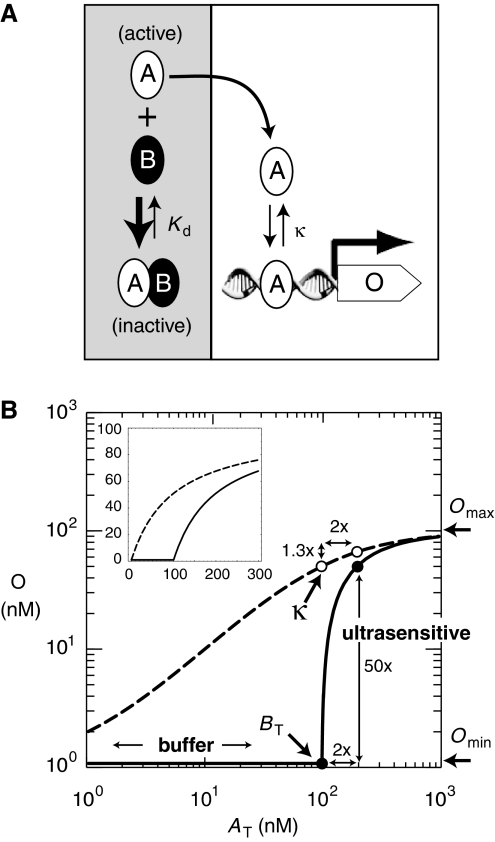
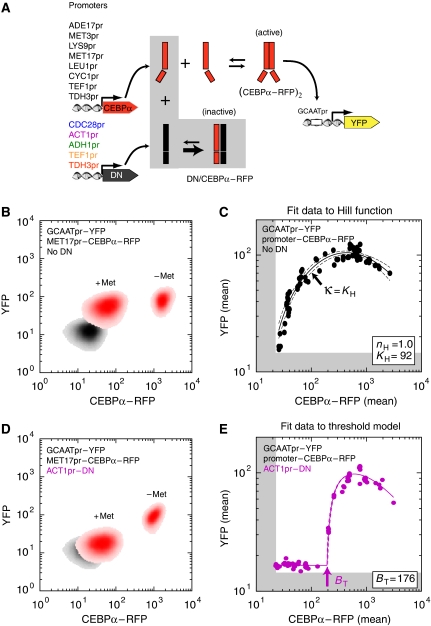
Ultrasensitive responses are crucial for cellular regulation. Protein sequestration, where an active protein is bound in an inactive complex by an inhibitor, can potentially generate ultrasensitivity. Here, in a synthetic genetic circuit in budding yeast, we show that sequestration of a basic leucine zipper transcription factor by a dominant-negative inhibitor converts a graded transcriptional response into a sharply ultrasensitive response, with apparent Hill coefficients up to 12. A simple quantitative model for this genetic network shows that both the threshold and the degree of ultrasensitivity depend upon the abundance of the inhibitor, exactly as we observed experimentally. The abundance of the inhibitor can be altered by simple mutation; thus, ultrasensitive responses mediated by protein sequestration are easily tuneable. Gene duplication of regulatory homodimers and loss-of-function mutations can create dominant negatives that sequester and inactivate the original regulator. The generation of flexible ultrasensitive responses is an unappreciated adaptive advantage that could explain the frequent evolutionary emergence of dominant negatives.


Conflict of interest statement

The authors declare that they have no conflict of interest.

Figures

Figure 1
Figure 1
A threshold model: How protein sequestration generates an ultrasensitive transcriptional response. (A) Active transcription factor A is sequestered by inhibitor B into an inactive AB complex that cannot bind DNA. The concentration of free, active A depends on the dimer dissociation constant (Kd) and the total concentration of transcription factor (AT=A+AB) and inhibitor (BT=B+AB) in a cell. For stoichiometric-binding conditions (BT/Kd≫1), the inhibitor serves as a finite sink that buffers and titrates free, activator A such that AAT/(BT/Kd) when AT<BT and AATBT when AT>BT (Buchler and Louis, 2008). At steady state, transcription of a target gene (output, O) by free activator A is Omin+Omax·A/(A+κ) and κ is the DNA-binding dissociation constant. The transcriptional response is non-cooperative (i.e. Hill coefficient nH=1) because the promoter contains a single DNA-binding site for the activator. (B) Logarithmic plot of the input–output response as a function of input (AT) for parameters κ=100 nM, Omax=100 nM, and Omin=1 nM (nanomolar). In bacteria or yeast, 1 nM≈1–25 molecules per cell, respectively. Inset: Linear plot of the input–output response. For a range of parameters, the transcriptional output of gene O in the presence of protein sequestration is well approximated by a threshold model where OOmin when AT<BT and OOmin+Omax·(ATBT)/((ATBT)+κ) when AT>BT (see Supplementary information). Consider the transcriptional response to a two-fold change in input (AT(low)=100 nM, AT(high)=200 nM, drawn as circles). In the absence of inhibitor (BT=0 nM, dashed curve and open circles), the transcriptional response will always be less than or equal to linear (e.g. two-fold change in input will be attenuated to a two-fold change or less in output). In the presence of inhibitor (BT=100 nM, solid curve and closed circles), the original input–output response is simply shifted to the right by BT (see inset) and the transcriptional response is now ultrasensitive at the equivalence point (ATBT). A process is ultrasensitive when a small fold change in input (2 × ) is amplified to a larger fold change (50 × ) in output, or when the response coefficient or logarithmic sensitivity is greater than one (Savageau, 1976; Goldbeter and Koshland, 1984). Both buffering and ultrasensitivity are a simple consequence of resetting the ‘zero point' of the original transcriptional response to the equivalence point, such that OOmin when AT<BT.
Figure 2
Figure 2
Protein sequestration generates an ultrasensitive transcriptional response: an experimental approach. (A) Scheme of our synthetic circuit in budding yeast. Our transactivator (CEBPα–RFP) consisted of an N-terminal fusion of a compact VP16 activation sequence (F2) and a C-terminal fusion of red fluorescent protein (mCherry) to a minimal basic leucine zipper (mouse CEBPα); see Supplementary information. All yeast strains contained yellow fluorescent protein (yEVenus) reporter, whose transcription was controlled by a ‘zero-background' MEL1 promoter with a single ‘GCAAT' binding site for the CEBPα–RFP dimer. Different strains had a high-affinity ‘3HF' dominant-negative inhibitor (DN), which sequesters CEBPα into an inactive complex (Krylov et al, 1995), expressed under constitutive promoters of increasing strength (from blue to red). Both reporter and dominant-negative plasmids were chromosomally integrated in a single copy at ADE2, and URA3 loci, respectively. For each reporter-only (No DN) or dominant-negative+reporter strain, we generated a range of steady-state transactivator concentrations by integrating different promoter–CEBPα–RFP plasmids with variable copy number in the LEU2 locus. (B) A density plot of fluorescence concentration (CEBPα–RFP, YFP) for a strain in which MET17pr–CEBPα–RFP plasmid was integrated into a reporter-only strain (No DN). MET17 is an amino-acid repressed promoter and we measured the steady-state response in two growth conditions (+Met, −Met). The strain with no reporter and transactivator (control for autofluorescence background) is shown in gray. (C) The full input–output response in reporter-only strain (No DN). Each data point is the mean CEBPα–RFP (input) and mean YFP (output) of a single transformant. All the data were least-squares fit with a Hill function Omin+OmaxċATnH/(ATnH+KHnH) modified to include squelching and subtraction of autofluorescence background determined from cells lacking reporter and transactivator (indicated by the edge of the gray shading); see Supplementary information. The solid line corresponds to the best fit and dashed lines are the 95% confidence intervals. The best-fit Hill coefficient (nH) and half-maximum concentration (KH) are shown in the box. The measured transcriptional response is graded and non-cooperative, thus the DNA-binding dissociation constant κ=KH (D) A density plot of fluorescence concentration (CEBPα–RFP, YFP) for a strain in which MET17pr–CEBPα–RFP plasmid was integrated into ACT1pr–DN+reporter strain. (E) The full input–output response in ACT1pr–DN+reporter strain. All data were least-squares fit with the threshold model (presented in Figure 1) modified to include squelching and subtraction of autofluorescence background (indicated by the edge of the gray shading); see Supplementary information. The best-fit threshold (indicated by arrow) is shown in the box.
Figure 3
Figure 3
Input–output threshold and ultrasensitivity are controlled by the concentration of dominant-negative inhibitor. (A) Full input–output response of the different dominant-negative inhibitor+reporter strains (data are color-coded similarly to Figure 2A). Best fit of the data to the modified threshold model is shown by solid lines (BT=0, 9, 176, 411, 1163, 1631; threshold indicated by arrows). (B) The abundance of DN was measured by quantitative western blotting and compared with the measured threshold (BT) of the input–output response. (C) Full input–output response of the different dominant-negative inhibitor+reporter strains. Best fit of data to the modified Hill function is shown by solid lines (nH=1.0, 1.3, 2.7, 5.7, 11.8, 11.4). (D) Plot of the fitted Hill coefficient from (C) as a function of fitted input–output threshold BT from (A) normalized by the fitted DNA-binding dissociation constant κ (from Figure 2C). All these quantities are dimensionless. Theoretical expectation (solid curve) was obtained by a least-squares fit of the Hill function to an ideal threshold model (infinite data points; no measurement error); see Supplementary information. The error bars for western blot data and fitted parameters are the s.e.m. and s.d. (at 68% confidence intervals), respectively.

References

    1. Ajo-Franklin CM, Drubin DA, Eskin JA, Gee EP, Landgraf D, Phillips I, Silver PA (2007) Rational design of memory in eukaryotic cells. Genes Dev 21: 2271–2276 - PMC - PubMed
    1. Benezra R, Davis RL, Lockshon D, Turner DL, Weintraub H (1990) The protein Id: a negative regulator of helix-loop-helix DNA binding proteins. Cell 61: 49–59 - PubMed
    1. Bintu L, Buchler NE, Garcia HG, Gerland U, Hwa T, Kondev J, Kuhlman T, Phillips R (2005) Transcriptional regulation by the numbers: applications. Curr Opin Genet Dev 15: 125–135 - PMC - PubMed
    1. Buchler NE, Louis M (2008) Molecular titration and ultrasensitivity in regulatory networks. J Mol Biol 384: 1106–1119 - PubMed
    1. Burke D, Dawson D, Stearns T (2000) Methods in Yeast Genetics: A Cold Spring Harbor Laboratory Course Manual. Cold Spring Harbor Laboratory Press

Publication types

MeSH terms

Substances

LinkOut - more resources