

Germinal center B cell-like (GCB) and activated B cell-like (ABC) type of diffuse large B cell lymphoma (DLBCL): analysis of molecular predictors, signatures, cell cycle state and patient survival
- PMID: 19455257
- PMCID: PMC2675856
Germinal center B cell-like (GCB) and activated B cell-like (ABC) type of diffuse large B cell lymphoma (DLBCL): analysis of molecular predictors, signatures, cell cycle state and patient survival
Abstract
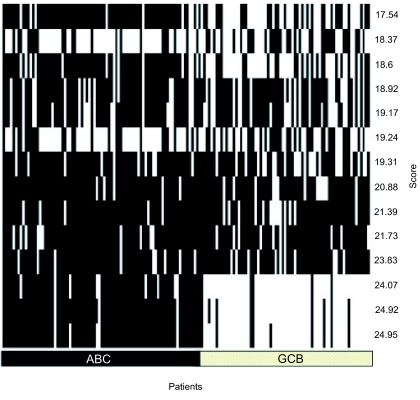
Aiming to find key genes and events, we analyze a large data set on diffuse large B-cell lymphoma (DLBCL) gene-expression (248 patients, 12196 spots). Applying the loess normalization method on these raw data yields improved survival predictions, in particular for the clinical important group of patients with medium survival time. Furthermore, we identify a simplified prognosis predictor, which stratifies different risk groups similarly well as complex signatures. We identify specific, activated B cell-like (ABC) and germinal center B cell-like (GCB) distinguishing genes. These include early (e.g. CDKN3) and late (e.g. CDKN2C) cell cycle genes. Independently from previous classification by marker genes we confirm a clear binary class distinction between the ABC and GCB subgroups. An earlier suggested third entity is not supported. A key regulatory network, distinguishing marked over-expression in ABC from that in GCB, is built by: ASB13, BCL2, BCL6, BCL7A, CCND2, COL3A1, CTGF, FN1, FOXP1, IGHM, IRF4, LMO2, LRMP, MAPK10, MME, MYBL1, NEIL1 and SH3BP5. It predicts and supports the aggressive behaviour of the ABC subgroup. These results help to understand target interactions, improve subgroup diagnosis, risk prognosis as well as therapy in the ABC and GCB DLBCL subgroups.
Keywords: cancer; gene expression; immunity; prognosis; regulation.
Figures


References
-
- Alizadeh AA, Eisen MB, Davis RE, et al. Distinct types of diffuse large B-cell lymphoma identified by gene expression profiling. Nature. 2000;403(6769):503–11. - PubMed
-
- Alizadeh A, Eisen M, Davis RE, et al. The lymphochip: a specialized cDNA microarray for the genomic-scale analysis of gene expression in normal and malignant lymphocytes. Cold Spring Harbor Symposia on Quantitative Biology. 1999;64:71–8. - PubMed
-
- Andersen P, Gill R. Cox’s regression model for counting processes, a large sample study. Annals of Statistics. 1982;10:1100–1120.
-
- de Lichtenberg U, Jensen LJ, Brunak S, et al. Dynamic complex formation during the yeast cell cycle. Science. 2005;307(5710):724–7. - PubMed
LinkOut - more resources
Full Text Sources
Other Literature Sources
Miscellaneous