

Discovering genetic ancestry using spectral graph theory
- PMID: 19455578
- PMCID: PMC4610359
- DOI: 10.1002/gepi.20434
Discovering genetic ancestry using spectral graph theory
Abstract
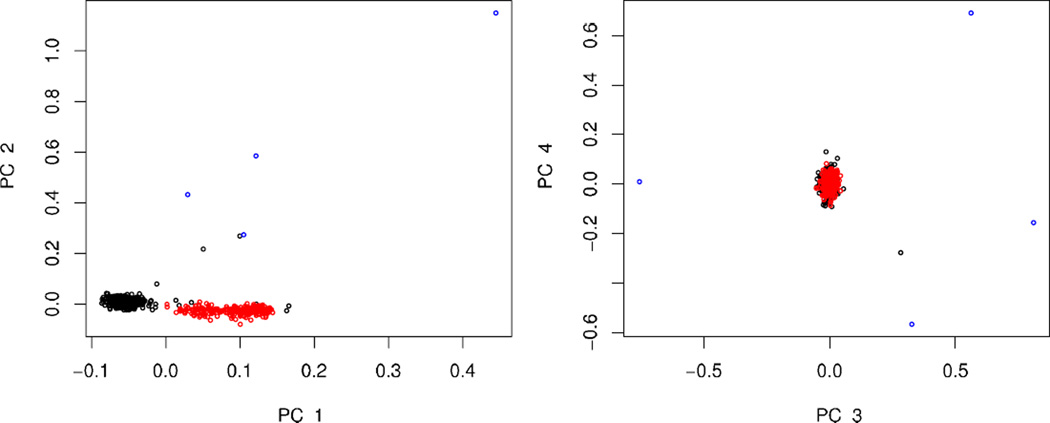
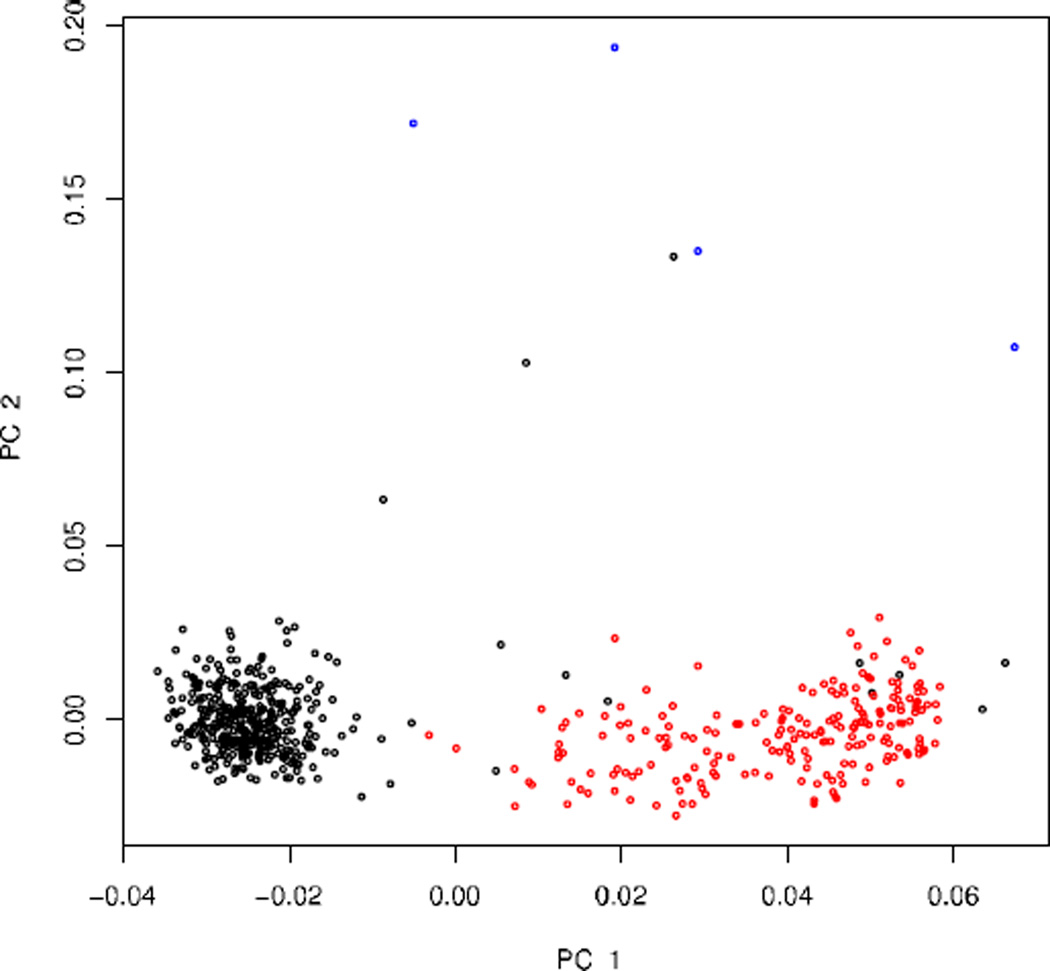
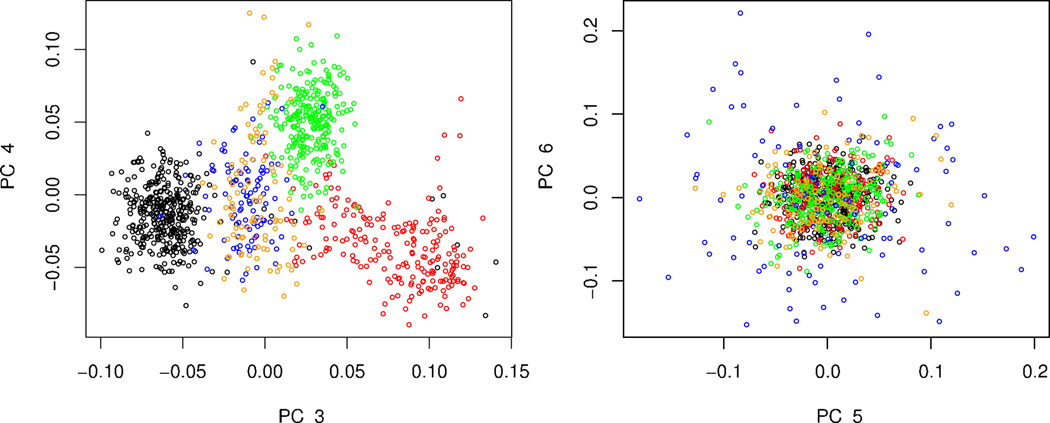
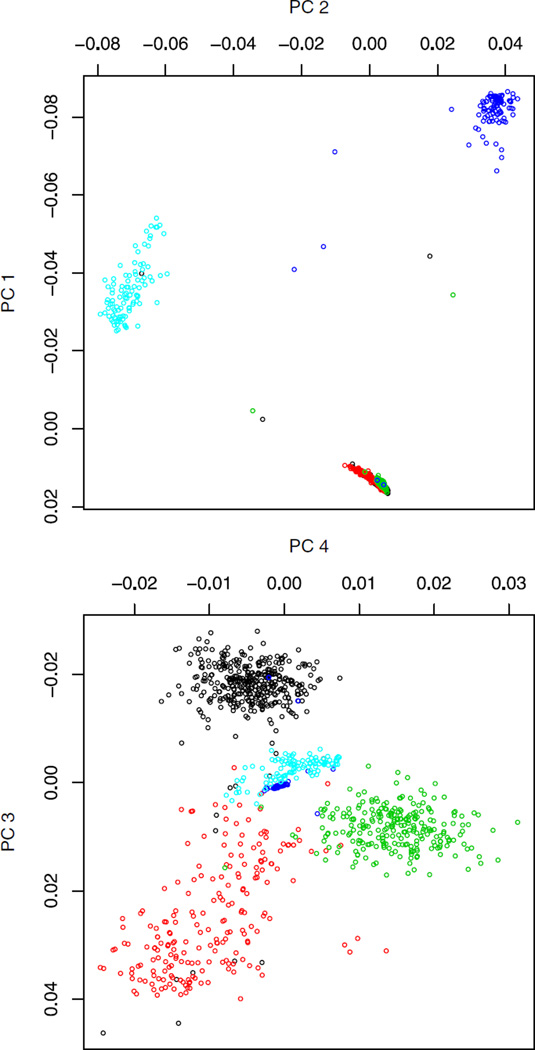
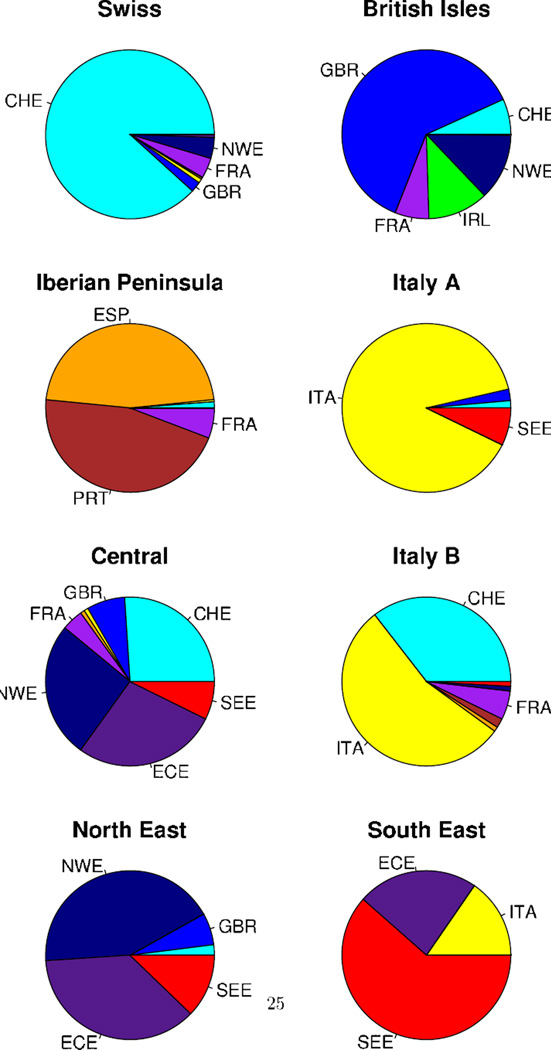
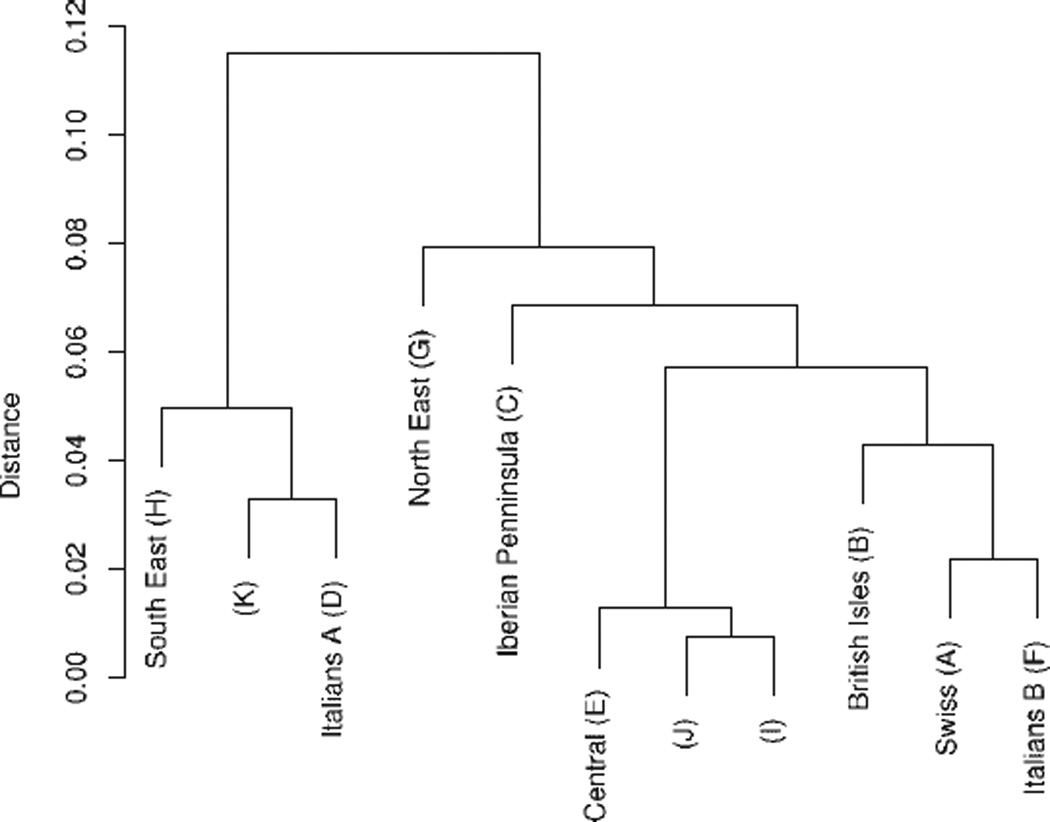
As one approach to uncovering the genetic underpinnings of complex disease, individuals are measured at a large number of genetic variants (usually SNPs) across the genome and these SNP genotypes are assessed for association with disease status. We propose a new statistical method called Spectral-GEM for the analysis of genome-wide association studies; the goal of Spectral-GEM is to quantify the ancestry of the sample from such genotypic data. Ignoring structure due to differential ancestry can lead to an excess of spurious findings and reduce power. Ancestry is commonly estimated using the eigenvectors derived from principal component analysis (PCA). To develop an alternative to PCA we draw on connections between multidimensional scaling and spectral graph theory. Our approach, based on a spectral embedding derived from the normalized Laplacian of a graph, can produce more meaningful delineation of ancestry than by using PCA. Often the results from Spectral-GEM are straightforward to interpret and therefore useful in association analysis. We illustrate the new algorithm with an analysis of the POPRES data [Nelson et al., 2008].
Figures
References
-
- Belkin M, Niyogi P. Laplacian eigenmaps and spectral techniques for embedding and clustering. Adv Neural Inf Process Sys. 2002;14
-
- Cavalli-Sforza L, Menozzi P, Piazza A. The History and Geography of Human Genes. Princeton: Princeton University Press; 1994.
-
- Chung F. Spectral graph theory. CBMS Regional Conference Series in Mathematics. 1992;92
-
- Heath SC, Gut IG, Brennan P, McKay JD, Bencko V, Fabianova E, Foretova L, Georges M, Janout V, Kabesch M, Krokan HE, Elvestad MB, Lissowska J, Mates D, Rudnai P, Skorpen F, Schreiber S, Soria JM, Syvnen AC, Meneton P, Herberg S, Galan P, Szeszenia-Dabrowska N, Zaridze D, Gnin E, Cardon LR, Lathrop M. Investigation of the fine structure of European populations with applications to disease association studies. Eur J Hum Genet. 2008;16:1413–1429. - PubMed
Publication types
MeSH terms
Grants and funding
LinkOut - more resources
Full Text Sources
Other Literature Sources
Research Materials
