. 2009 Jul 7;48(26):6249-58.
doi: 10.1021/bi900373x.

Transmembrane helix 12 modulates progression of the ATP catalytic cycle in ABCB1

Affiliations

Transmembrane helix 12 modulates progression of the ATP catalytic cycle in ABCB1

Emily Crowley et al. Biochemistry. .

Abstract

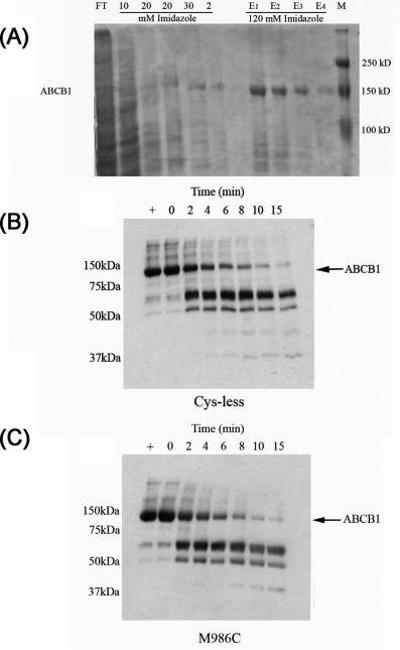
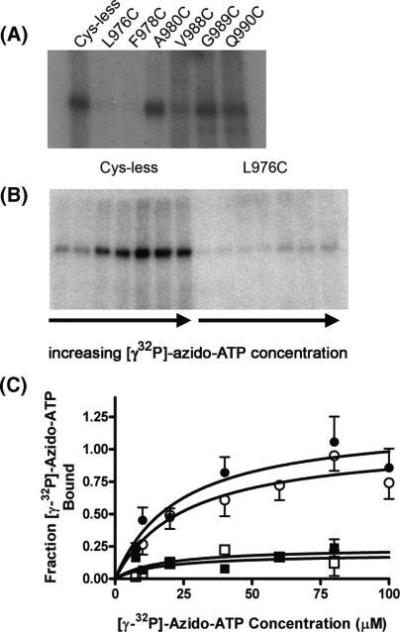
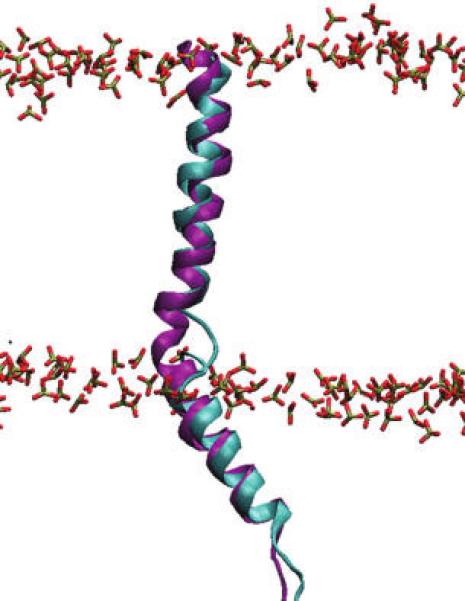
Multidrug efflux pumps, such as P-glycoprotein (ABCB1), present major barriers to the success of chemotherapy in a number of clinical settings. Molecular details of the multidrug efflux process by ABCB1 remain elusive, in particular, the interdomain communication associated with bioenergetic coupling. The present investigation has focused on the role of transmembrane helix 12 (TM12) in the multidrug efflux process of ABCB1. Cysteine residues were introduced at various positions within TM12, and their effect on ATPase activity, nucleotide binding, and drug interaction were assessed. Mutation of several residues within TM12 perturbed the maximal ATPase activity of ABCB1, and the underlying cause was a reduction in basal (i.e., drug-free) hydrolysis of the nucleotide. Two of the mutations (L976C and F978C) were found to reduce the binding of [gamma-(32)P]-azido-ATP to ABCB1. In contrast, the A980C mutation within TM12 enhanced the rate of ATP hydrolysis; once again, this was due to modified basal activity. Several residues also caused reductions in the potency of stimulation of ATP hydrolysis by nicardipine and vinblastine, although the effects were independent of changes in drug binding per se. Overall, the results indicate that TM12 plays a key role in the progression of the ATP hydrolytic cycle in ABCB1, even in the absence of the transported substrate.


Figures

Figure 1
Figure 1
Expression of ABCB1 in high-five insect cells. A representative immunoblot of the expression of ABCB1 mutant isoforms expressed in high-five cells. ABCB1 expression was detected following SDS–PAGE on 7.5% (w/v) acrylamide gels and immunoblotting with the monoclonal antibody C219. The total amount of protein loaded onto each lane was 15 μg.
Figure 2
Figure 2
Purification and partial proteolysis of ABCB1 isoforms. (A) ABCB1 mutant isoforms were extracted from insect cell membranes by 2% (w/v) octyl-glucoside, purified by immobilized metal-affinity chromatography, and analyzed by SDS–PAGE. FT denotes the flow through, and the following five lanes represent the wash steps (up to 30 mM imidazole) to remove protein bound weakly to the resin. E1–E4 represent four elution steps at 120 mM imidazole. ABCB1 is indicated by an arrow, and M denotes the molecular marker. Proteolysis of purified, reconstituted Cys-less (B) and M986C (C) was carried out in the presence of 0.5 μg of bovine pancreatic trypsin. Time denotes the incubation period of the protein with trypsin at 37 °C (see the Materials and Methods). Protein was detected using C219 antibody following immunoblotting. Undigested ABCB1 is indicated by the arrow. The positive control corresponds to no proteolytic digestion by trypsin.
Figure 3
Figure 3
ATPase activity of cysteine-less ABCB1 isoform. ATP hydrolysis of purified, reconstituted cysteine-less ABCB1 was measured using a colorimetric assay that detects the release of inorganic phosphate. (A) Activity was measured as a function of the ATP concentration (0–1.75 mM) for cysteine-less ABCB1 in the absence (□) or presence of nicardipine (●) or vinblastine (○). (B) Activity was measured as a function of either the nicardipine (●) or vinblastine (○) concentration at 2 mM ATP. Nonlinear least-squares regression was used to fit the Michaelis–Menten equation (A) or the general dose–response equation (B) to the data. Values represent the mean ± standard error of the mean (SEM) obtained from at least four independent protein preparations.
Figure 4
Figure 4
Maximal ATPase activity of TM12 mutant isoforms. ATPase activity of the mutant isoforms was determined under basal (A) and drug-stimulated conditions (B, nicardipine; C, vinblastine). The maximal ATPase activity (Vmax) was determined from Michaelis–Menten curves (comparable to those in Figure 3) and is represented for each isoform in the form of a bar chart. The values represent the mean ± SEM of at least three independent purifications, and an asterisk refers to a statistically significant difference (p<0.05) compared to the Cys-less isoform.
Figure 5
Figure 5
Nucleotide binding to TM12 mutant isoforms. Mutant isoforms (0.3 μg) were incubated with [γ-32P]-azido-ATP; cross-linked protein was resolved using SDS–PAGE; and the amount of bound radiolabel was detected by autoradiography. (A) Representative autoradiogram showing altered binding of [γ-32P]-azido-ATP (10 μM) to isoforms. (B) Autoradiograms showing the binding of [γ-32P]-azido-ATP (10–100 μM) to the purified, reconstituted cysteine-less and L976C mutant isoforms. (C) Data obtained for the cysteine-less, L976C, F978C, and A980C isoforms were analyzed by densitometry, and the amount bound was plotted as a function of the [γ-32P]-azido-ATP concentration. Nonlinear least-squares regression was used to fit the Langmuir binding isotherm to the data. The values represent the mean ± SEM obtained from at least three independent protein preparations.
Figure 6
Figure 6
In silico TM12 mutations. In each case, TM12 is colored purple and the head groups of the POPE bilayer are shown in CPK liquorice representations. The remaining TM helices are shaded gray, unless otherwise specified. Water in the substrate translocation pore and associated with TM protein is rendered blue. (A) Wild-type A980 (CPK spacefill) is located in the TM9–TM12 cleft and has no significant protein interactions. (B) Mutation to A980C allows for hydrogen bonding to S850 (orange), increasing TM12–TM9 contacts. (C) F978 (CPK spacefill) is located on the TM12–TM1 helix–helix interface and hydrogen bonds with F72 (orange). (D) Mutation to F978C (CPK) prevents hydrogen bonding to F72.
Figure 7
Figure 7
Sequence alignment and hydrogen-bonding profile of TM6 and TM12 through the membrane. (A) Sequence alignment of ABCB1 TM6/ICL3 and TM12/ICL6 shows a very high level of sequence conservation between the two regions, with approximately 80% sequence similarity and 45% sequence identity. Mutations altering ATPase activity are shaded green and numbered. The proposed TM6 and TM12 hinges are shaded cyan. Identical residues are marked with an asterisk, conserved residues are identified by “:” or “·” depending upon the degree of sequence conservation. (B) Side profile of TM12 (purple) shows only one major disruption in the normal α-helical hydrogen-bonding pattern (green dashed lines), corresponding to a marked kink in TM12 located near the cytoplasmic lipid–water interface. TM6 is shown for reference, and the residues implicated in the TM6 hinge (cyan) and the POPE head groups (CKP coloring) are illustrated in liquorice representation.
Figure 8
Figure 8
Comparison of the lipid-embedded human TM12 homology model and TM12 from the mouse P-glycoprotein A crystal structure. A comparison of the lipid-embedded human TM12 homology model (purple) and TM12 from the mouse P-glycoprotein A crystal structure (cyan). Both the TM12 homology model and crystal structure show a marked kink near the intracellular lipid–water interface, corresponding to the conserved sequence motif SSFAPD found in both humans (S992–D997) and mice (V988–S993). Here, the lipid phosphates are shown as stick representations.

References

    1. Cordon-Cardo C, O’Brien JP, Casals D, Rittman-Grauer L, Biedler JL, Melamed MR, Bertino JR. Multidrug-resistance gene (P-glycoprotein) is expressed by endothelial cells at blood–brain barrier sites. Proc. Natl. Acad. Sci. U.S.A. 1989;86:695–698. - PMC - PubMed
    1. Pavelic ZP, Reising J, Pavelic L, Kelley DJ, Stambrook PJ, Gluckman JL. Detection of P-glycoprotein with four monoclonal antibodies in normal and tumor tissues. Arch. Otolaryngol., Head Neck Surg. 1993;119:753–757. - PubMed
    1. Smit JJ, Schinkel AH, Mol CA, Majoor D, Mooi WJ, Jongsma AP, Lincke CR, Borst P. Tissue distribution of the human MDR3 P-glycoprotein. Lab. Invest. 1994;71:638–649. - PubMed
    1. Cordon-Cardo C, O’Brien JP, Boccia J, Casals D, Bertino JR, Melamed MR. Expression of the multidrug resistance gene product (P-glycoprotein) in human normal and tumor tissues. J. Histochem. Cytochem. 1990;38:1277–1287. - PubMed
    1. Gottesman MM, Fojo T, Bates SE. Multidrug resistance in cancer: Role of ATP-dependent transporters. Nat. Rev. Cancer. 2002;2:48–58. - PubMed

Publication types

MeSH terms