. 2009 May 20:10:154.
doi: 10.1186/1471-2105-10-154.

EDGAR: a software framework for the comparative analysis of prokaryotic genomes

Affiliations

EDGAR: a software framework for the comparative analysis of prokaryotic genomes

Jochen Blom et al. BMC Bioinformatics. .

Abstract

Background: The introduction of next generation sequencing approaches has caused a rapid increase in the number of completely sequenced genomes. As one result of this development, it is now feasible to analyze large groups of related genomes in a comparative approach. A main task in comparative genomics is the identification of orthologous genes in different genomes and the classification of genes as core genes or singletons.

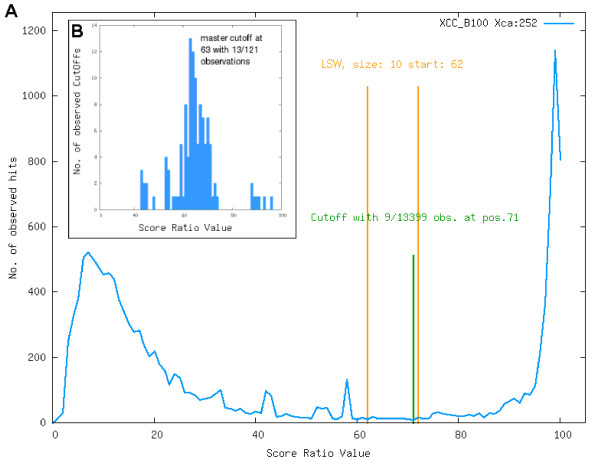
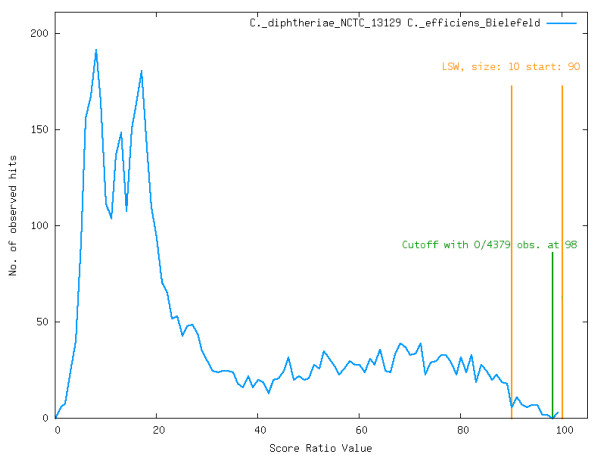
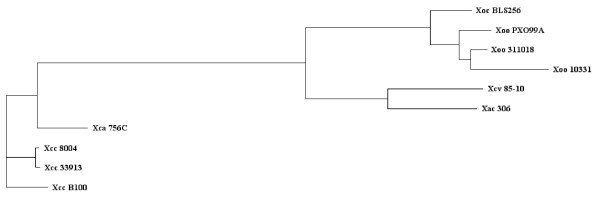
Results: To support these studies EDGAR - "Efficient Database framework for comparative Genome Analyses using BLAST score Ratios" - was developed. EDGAR is designed to automatically perform genome comparisons in a high throughput approach. Comparative analyses for 582 genomes across 75 genus groups taken from the NCBI genomes database were conducted with the software and the results were integrated into an underlying database. To demonstrate a specific application case, we analyzed ten genomes of the bacterial genus Xanthomonas, for which phylogenetic studies were awkward due to divergent taxonomic systems. The resultant phylogeny EDGAR provided was consistent with outcomes from traditional approaches performed recently and moreover, it was possible to root each strain with unprecedented accuracy.

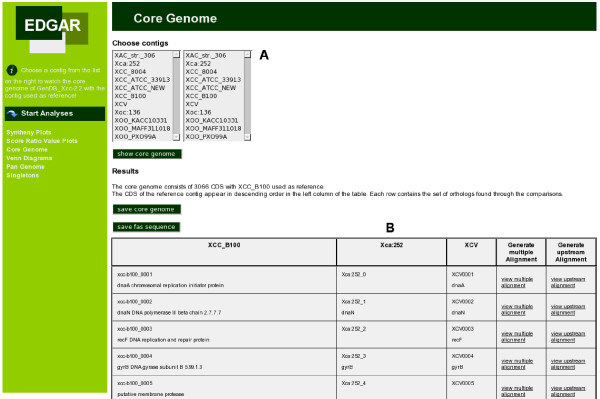
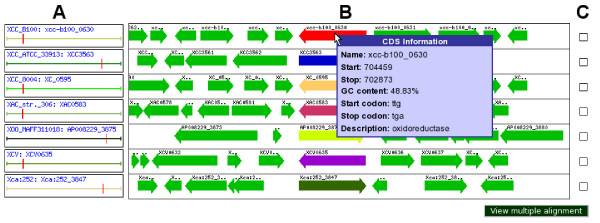
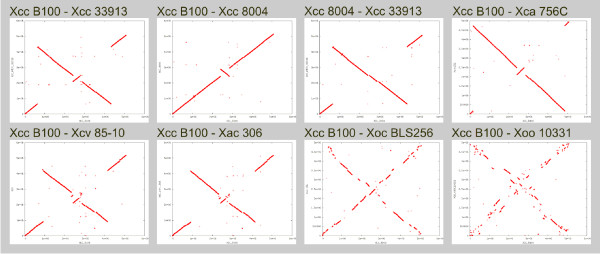
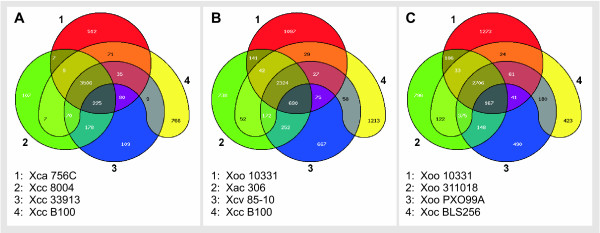
Conclusion: EDGAR provides novel analysis features and significantly simplifies the comparative analysis of related genomes. The software supports a quick survey of evolutionary relationships and simplifies the process of obtaining new biological insights into the differential gene content of kindred genomes. Visualization features, like synteny plots or Venn diagrams, are offered to the scientific community through a web-based and therefore platform independent user interface http://edgar.cebitec.uni-bielefeld.de, where the precomputed data sets can be browsed.


Figures

Figure 1
Figure 1
BLAST score ratios. (A) Histogram of the SRVs (multiplied by 100 to gain percent values) resulting from the comparison of Xcc B100 and Xca 756C. The distribution of the SRVs is clearly bimodal with one peak at 7% and one peak at 98%. The lowest scoring window (LSW) with a size of 10 was estimated at positions 62 – 72, the lowest single value at position 71, thus giving a cutoff of 71% for this genome comparison. The histogram of the calculated cutoffs for all 121 possible comparisons of Xanthomonas genomes can be seen in panel (B). The calculated cutoffs show a normal distribution with a peak 63%, by this defining the master-cutoff for the orthology estimation among Xanthomonas genomes.
Figure 2
Figure 2
SRVs for Corynebacterium genus. Histogram of the SRVs (multiplied by 100 to gain percent values) resulting from the comparison of two Corynebacterium strains. There is no clear peak at the high score region of the histogram. The lowest scoring window is found at positions 90 – 100 and the lowest single value is found at 98%. In this comparison the vast majority of all BLAST hits would be left out. For this reason the cutoff for genome comparisons showing no bimodal distribution is automatically set to 35%.
Figure 3
Figure 3
Phylogenetic tree of Xanthomonas strains. Phylogenetic tree of the Xanthomonas chromosomes currently available in public databases. Based on the core genome of 2,156 CDS the divergence of these plant-pathogenic bacteria was quantified with the recently annotated Xcc B100 employed as reference to construct the tree. The Xcc genomes and Xca cluster closely together, and are linked by a common branch to the remaining Xanthomonads. Here Xca and Xcv diverge from the X. oryzae chromosomes. Among these rice pathogens Xoc forms a first side branch, while the Xoo genomes cluster together.
Figure 4
Figure 4
Web interface: Core genome presentation. Screenshot of the core genome calculation in the EDGAR web interface. In the upper part (A) one can choose a reference genome and a set of genomes to compare it with. The resulting table is shown in the lower part (B) of the page, in this case the core genome table for Xcc B100, Xca 756C, and Xcv 85-10. EDGAR displays the orthologous genes of all compared strains together with their gene function (as far as it is known) for every gene in the core genome. For every set of orthologous genes multiple alignments can be constructed of the genes itself and of their upstream region.
Figure 5
Figure 5
Web interface: Comparative view. Comparative view of seven orthologous genes of the Xanthomonas genus. In the left part (A) the location of the genes in their respective genome is shown by the red vertical marks. In the middle section (B) a linear view of the orthologous genes and their genomic neighborhood is displayed. Some information on the depicted genes can be seen by a mouseover window. The checkboxes on the right (C) allow the user to select genes for multiple alignments.
Figure 6
Figure 6
Synteny of the Xanthomonas chromosomes. Synteny of the Xanthomonas chromosomes. In order to monitor the conservation of gene order among the Xanthomonas chromosomes, pairwise synteny plots were generated with EDGAR, where the position of each CDS of the chromosome given on the X axis is plotted against the position of its homologue in the second chromosome given on the Y axis. Identical chromosomes result in a diagonal plot. The names of the analyzed chromosome pairs are given on top of each plot. Among the Xcc and Xca chromosomes there are few chromosomal rearrangements, some of which indicate large-scale inversion events. The number of rearrangements increases rather subtly when the Xca/Xcv chromosomes are compared to Xcc strains. A substantial increase in rearrangements becomes obvious for Xoc BLS256 when compared to Xcc B100, while the gene order seems almost disintegrated in Xoo 10331 (similar data for the other Xoo chromosomes not shown). While synteny analysis is restricted to complete genome data for obvious reasons, other tools like the phylogenetic tree analysis of the Venn diagrams are also available for draft genome data.
Figure 7
Figure 7
Venn diagrams. Venn diagrams. EDGAR facilitates visualizing common gene pools of by Venn diagrams. This analysis exploits all CDS of the genomes and is not restricted to the core genome. In each individual analysis at most 5 genomes can be included, as considering more chromosomes results in rather confusing visualization. Results for the X. campestris strains pathogenic to crucifers and the rice-pathogenic X. oryzae that were clustered in the phylogenetic analysis (Figure 4) are displayed in panels A and C, respectively. Among the X. campestris chromosomes in panel A a particular high similarity between Xcc 33913 and Xcc 8004 became evident. The chromosomes shared 178 orthologous CDS exclusively, and further 225 CDS conjointly with strain Xca 756C. In panel C among the X. oryzae genomes, the chromosomes of X. oryzae pv. oryzae strains shared 375 orthologs, while the X. oryzae pv. oryzicola chromosome overlapped less with the Xoo chromosomes. In panel B the Xac and Xcv chromosomes that clustered in between the X. campestris and X. oryzae groups were compared with each other and a representative of the X. campestris and X. oryzae groups. The analysis brought to light a surprisingly high number of 690 orthologs shared among Xac, Xcv and the Xoo representative, indicating closer connections of these strains to the X. oryzae group than to the crucifer pathogenic X. campestris strains.

Similar articles

Cited by

References

    1. Hollricher K. Microbial systematics – Species Don't Really Mean Anything in the Bacterial World. Lab Times. 2007;5:22–25.
    1. Wayne LG, Brenner DJ, Colwell RR, Grimont PAD, Kandler O, Krichevsky MI, Moore LH, More WEC, Murray RGE, Stackebrandt E, Starr MP, Trüper HG. Report of the Ad Hoc Committee on Reconciliation of Approaches to Bacterial Systematics. International Journal of Systematic Bacteriology. 1987;37:463–464.
    1. Hiller NL, Janto B, Hogg JS, Boissy R, Yu S, Powell E, Keefe R, Ehrlich NE, Shen K, Hayes J, Barbadora K, Klimke W, Dernovoy D, Tatusova T, Parkhill J, Bentley SD, Post JC, Ehrlich GD, Hu FZ. Comparative genomic analyses of seventeen Streptococcus pneumoniae strains: insights into the Pneumococcal Supragenome. Journal of Bacteriology. 2007;189:8186–8195. - PMC - PubMed
    1. Tettelin H, Masignani V, Cieslewicz MJ, Donati C, Medini D, Ward NL, Angiuoli SV, Crabtree J, Jones AL, Durkin AS, Deboy RT, Davidsen TM, Mora M, Scarselli M, y Ros IM, Peterson JD, Hauser CR, Sundaram JP, Nelson WC, Madupu R, Brinkac LM, Dodson RJ, Rosovitz MJ, Sullivan SA, Daugherty SC, Haft DH, Selengut J, Gwinn ML, Zhou L, Zafar N, Khouri H, Radune D, Dimitrov G, Watkins K, O'Connor KJB, Smith S, Utterback TR, White O, Rubens CE, Grandi G, Madoff LC, Kasper DL, Telford JL, Wessels MR, Rappuoli R, Fraser CM. Genome analysis of multiple pathogenic isolates of Streptococcus agalactiae: implications for the microbial "pan-genome". Proceedings of the National Academy of Sciences of the United States of America. 2005;102:13950–13955. - PMC - PubMed
    1. Medini D, Donati C, Tettelin H, Masignani V, Rappuoli R. The microbial pan-genome. Current Opinion in Genetics & Development. 2005;15:589–594. - PubMed

Publication types