. 2009 May 20:10:155.
doi: 10.1186/1471-2105-10-155.

BRNI: Modular analysis of transcriptional regulatory programs

Affiliations

BRNI: Modular analysis of transcriptional regulatory programs

Iftach Nachman et al. BMC Bioinformatics. .

Abstract

Background: Transcriptional responses often consist of regulatory modules - sets of genes with a shared expression pattern that are controlled by the same regulatory mechanisms. Previous methods allow dissecting regulatory modules from genomics data, such as expression profiles, protein-DNA binding, and promoter sequences. In cases where physical protein-DNA data are lacking, such methods are essential for the analysis of the underlying regulatory program.

Results: Here, we present a novel approach for the analysis of modular regulatory programs. Our method - Biochemical Regulatory Network Inference (BRNI) - is based on an algorithm that learns from expression data a biochemically-motivated regulatory program. It describes the expression profiles of gene modules consisting of hundreds of genes using a small number of regulators and affinity parameters. We developed an ensemble learning algorithm that ensures the robustness of the learned model. We then use the topology of the learned regulatory program to guide the discovery of a library of cis-regulatory motifs, and determined the motif compositions associated with each module.We test our method on the cell cycle regulatory program of the fission yeast. We discovered 16 coherent modules, covering diverse processes from cell division to metabolism and associated them with 18 learned regulatory elements, including both known cell-cycle regulatory elements (MCB, Ace2, PCB, ACCCT box) and novel ones, some of which are associated with G2 modules. We integrate the regulatory relations from the expression- and motif-based models into a single network, highlighting specific topologies that result in distinct dynamics of gene expression in the fission yeast cell cycle.

Conclusion: Our approach provides a biologically-driven, principled way for deconstructing a set of genes into meaningful transcriptional modules and identifying their associated cis-regulatory programs. Our analysis sheds light on the architecture and function of the regulatory network controlling the fission yeast cell cycle, and a similar approach can be applied to the regulatory underpinnings of other modular transcriptional responses.


Figures

Figure 1
Figure 1
Modeling Transcriptional Regulation. (a) The S. pombe cell cycle transcriptional regulatory program. Shown are the phases of the cell cycle, known regulators and their regulatory interactions (arrows – activation; blunt arrows – repression). Figure adapted from [9], with some additions. (b) A qualitative molecular model of transcriptional regulation. mRNA encoding a transcription factor (TF, orange oval) is translated to protein (yellow oval). The protein is activated (pink oval) and induces the transcription of a target gene at a certain rate (G, blue oval). The final accumulation of G mRNA levels (G, orange oval) is determined by this transcription rate and by the rate of G's mRNA degradation. Each of the ovals is associated with a relevant quantity (TF mRNA level, TF protein level, activated TF protein level, transcription rate of the target gene G and mRNA level of G). A microarray experiment only measures the first and last of these quantities ("observed"), whereas the other quantities are not observed ("hidden"). The dashed oval encloses the closest quantities on this path between the TF and the target gene G. Our approach models the connection between these two variables.
Figure 2
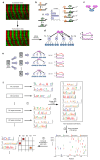
Figure 2
Flow of the integrated analysis. (a-d) Learning a biochemically based regulatiozn model. The input for model learning is transcription rates derived from mRNA levels (a). A biochemical model of TF binding and dissociation (b) is used to describe the transcription rate of a target gene. The binding and dissociation kinetics of each transcription factor (orange and green ovals) to the target gene promoter (left panel) are governed by affinity parameters (γ1 and γ2, respectively). These kinetics result in a distribution of promoter states within the cell population (middle panel). Each promoter state is associated with a distinct transcription rate (αa through αd, right panel). These regulation functions are used within a probabilistic graphical model (c) where the observed transcription rates of a target gene (G, blue oval) are explained using the hidden active protein levels of the regulators (R1 and R2, pink ovals). In practice we learn a modular model (d), where the genes belonging to a single module (square nodes) share the same set of affinity and transcription rate parameters {γ, α}. The model topology describes which regulators control each of the modules, and which genes are members of each module. In addition, the regulator activity profiles (right) and all kinetic parameters are inferred. (e) An ensemble learning approach. From the original set of genes (G, barrel), m subsets (G1 through Gm) are randomly sampled, each containing some fraction (e.g. 80%) of the genes. A modular regulation model is learned for each subset as in (d). The resulting ensemble of models is integrated into a unified consensus model (Methods). First, regulators are mapped between different runs based on their time profile similarities (e.g. red profiles on right panel). Next, core gene modules are defined based on sets of genes that frequently co-occur in the same module. (f) Learning a motif-based regulation model. Subsets of genes are defined either by members of a module, or by targets of a regulator in the unified model. The promoters of these gene subsets are searched for novel cis-regulatory motifs using four different algorithms. The resulting redundant collection of motifs is clustered and merged to generate a non-redundant library of motifs. The promoters of all genes are then scanned against this library, and enrichments of gene sets for particular motifs are computed.
Figure 3
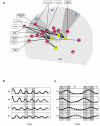
Figure 3
An integrated model of transcriptional modules in S. pombe cell cycle. (a) A map of the unified model topology. Shown are fifteen modules (red nodes) and four regulators (yellow nodes) and their regulatory connections (thick edges) along the S. pombe cell cycle. The angular position and the radial distance of each module node represent the respective average peak phase and the average amplitude of transcription rates among the module members. The angular position of each regulator node represents the peak phase of its activity profile. Known cell cycle regulators that could be associated with a particular module (as members) are denoted within the module node (transcription factors – white; kinases – green). The blue edge signifies a repressive regulatory connection, while all the other connections are activatory. The thin edges connect modules with binding motifs that are significantly enriched in the module's promoters (see Additional file 3). (b) Inferred activity profiles of the four regulators R1-R4 in the unified model. Mean and one standard deviation curves are shown. (c) Zoom-in of the middle time series (Elutriation 2) in (b).
Figure 4
Figure 4
Promoter composition vs. expression profiles of module genes. Shown is the promoter composition of genes in a module (left panel) along with the expression profiles of the corresponding genes (right panel). Each row represents one gene, where gene names are shown on the left. Binding sites for selected motifs are denoted by color bars, while position is denoted as distance from ATG. (a) Module 2 (b) Module 4 and Module 6.
Figure 5
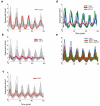
Figure 5
Coherence of regulator expression with that of its targets. (a-c) Shown are the expression profiles of a transcription factor (red, magenta) vs. the expression profiles of all cycling genes whose promoter contains a binding motif for that factor (light gray). (a) ace2; (b) MBF (two cycling components are shown); (c) fkh2. (d) Expression profiles of histone genes in Module 1 (blue), ams2 (green) and MBF components rep2 (red) and cdc10 (magenta). (e) Expression profiles of cycling genes containing either an MCB motif (blue), an ACCCT box (red) or both (green).
Figure 6
Figure 6
A transcriptional regulation network for the S. pombe cell cycle. (a) An enhanced model for the transcriptional regulatory network controlling the S. pombe cell cycle. New insights or connections are denoted in red. Connections to novel motifs related to unknown regulators are denoted in green dashed lines. Fkh2* denotes Fkh2 bound to its target promoter. (b-d) Some of the regulatory motifs found in the cell cycle network. (b) Ace2 regulates its targets through a simple direct activation. (c) Ams2, controlled by MBF through the MCB motif, binds the ACCCT box [17]. Different genes have different combinations of these two sites in their promoters. Genes that have both MBF and Ams2 sites are part of a feed-forward loop. (d) Fkh2 regulates itself through a negative feedback loop, while being activated by Mbx1/Sep1/Plo1 complex.

References

    1. Akutsu T, Miyano S, Kuhara S. Identification of genetic networks from a small number of gene expression patterns under the Boolean network model. Pacific Symposium on Biocomputing. 1999:17–28. - PubMed
    1. Friedman N, Linial M, Nachman I, Pe'er D. Using Bayesian networks to analyze expression data. J Comput Biol. 2000;7:601–620. doi: 10.1089/106652700750050961. - DOI - PubMed
    1. Kim S, Imoto S, Miyano S. Dynamic Bayesian network and nonparametric regression for nonlinear modeling of gene networks from time series gene expression data. Bio Systems. 2004;75:57–65. - PubMed
    1. Liao JC, Boscolo R, Yang YL, Tran LM, Sabatti C, Roychowdhury VP. Network component analysis: reconstruction of regulatory signals in biological systems. Proceedings of the National Academy of Sciences of the United States of America. 2003;100:15522–15527. doi: 10.1073/pnas.2136632100. - DOI - PMC - PubMed
    1. Segal E, Shapira M, Regev A, Pe'er D, Botstein D, Koller D, Friedman N. Module networks: identifying regulatory modules and their condition-specific regulators from gene expression data. Nature genetics. 2003;34:166–176. doi: 10.1038/ng1165. - DOI - PubMed

Publication types