

doi: 10.1016/j.neuroimage.2009.01.033.
Epub 2009 Feb 3.
Real-time imaging of human brain function by near-infrared spectroscopy using an adaptive general linear model
Affiliations
- PMID: 19457389
- PMCID: PMC2758631
- DOI: 10.1016/j.neuroimage.2009.01.033
Item in Clipboard
Real-time imaging of human brain function by near-infrared spectroscopy using an adaptive general linear model
Neuroimage.
.
Abstract
Near-infrared spectroscopy is a non-invasive neuroimaging method which uses light to measure changes in cerebral blood oxygenation associated with brain activity. In this work, we demonstrate the ability to record and analyze images of brain activity in real-time using a 16-channel continuous wave optical NIRS system. We propose a novel real-time analysis framework using an adaptive Kalman filter and a state-space model based on a canonical general linear model of brain activity. We show that our adaptive model has the ability to estimate single-trial brain activity events as we apply this method to track and classify experimental data acquired during an alternating bilateral self-paced finger tapping task.
Figures

Schematic of real-time analysis process stream. Real-time data collection, analysis, and biofeedback were handled by three separate computers which networked via network communications. Each of the major components of this process is discussed in separate sections of this text.
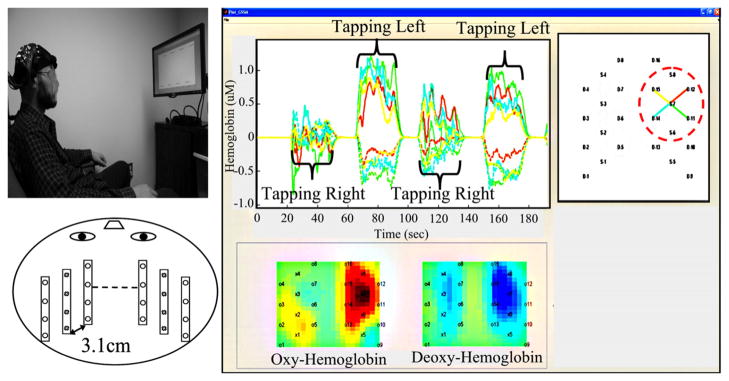
Experimental setup and graphical interface for real-time studies. On the left of this figure is shown the optical probe geometry and subject orientation for the motor task study. The bilateral fiber optic probe was placed on the subject’s head, while seated viewing the biofeedback monitor. In the panel on the right is shown our real-time display with data collected from subject B. Labels for the tapping epochs have been added for clarity. The time-course of oxy- (solid lines) and deoxy-hemoglobin (dotted lines) are shown for four optical source-detector pairs from the right motor cortex (upper right panel). The real-time interface displays the back-projection image of oxy- and deoxy-hemoglobin for the most current trial (in this case, a left-hand tapping trial is shown).
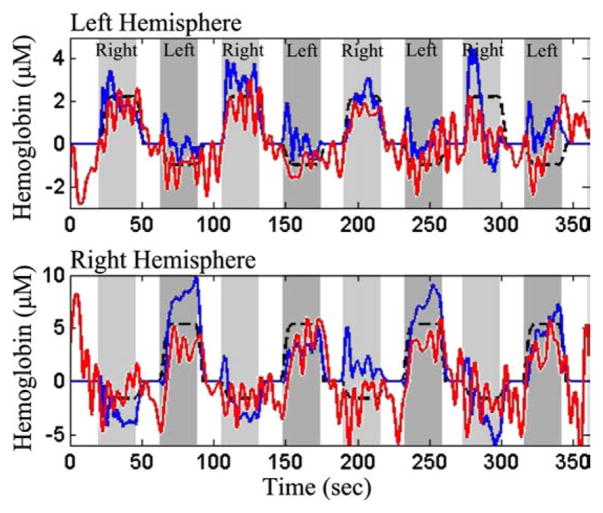
Region-of-interest time-courses of raw and Kalman filtered signals. In this figure is shown region-of-interest signals from the left and right motor cortices and the response to the two hand tapping conditions. In each plot, an entire 6 min data run is shown. The red line shows the raw (unfiltered) data as recorded by our system. The blue line shows the results of our Kalman filter. Finally, the black line shows the idealized result from a static estimate of the general linear model accounting for the different conditions. Labels for the right and left handed tapping are added for clarity.

Real-time classification of handedness. The linear classifier was used to estimate left versus right-handed tapping. In this figure, the results for a single data run is shown (subject B; same as Fig. 3). Correct (circle) and incorrect (cross) labeled data points are shown. Data points classified as right-handed are displayed on the bottom and left-handed are displayed on the top. During the experiment, the subject viewed an image similar to this figure (of course, without the correct/incorrect labels and marked “truth”) as shown in Fig. 1.
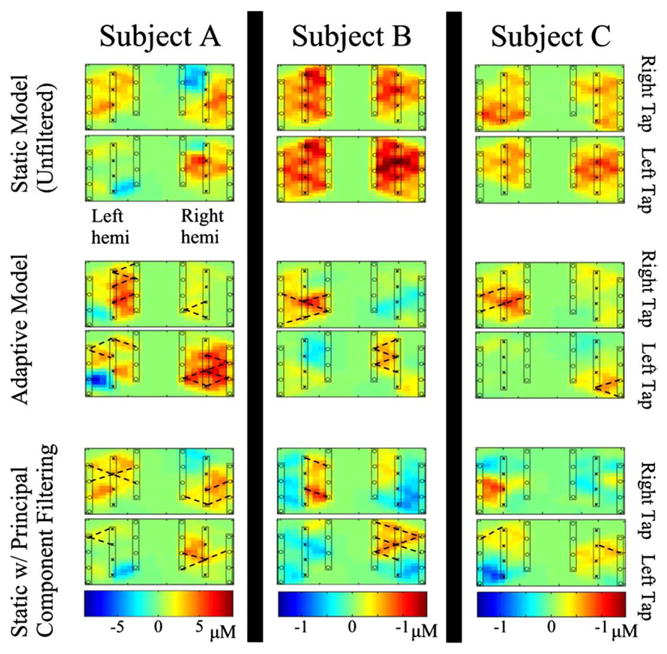
Spatial images of left and right motor activity. In this figure, we show back-projection images constructed from the post-hoc average of all left and right activations for the three subjects. In the top row, we show images reconstructed from the raw data prior to any filtering. The middle row shows that results from our adaptive estimator, which includes regressors to remove systemic fluctuations. The expected contralateral activations are seen for each subject. Finally, in the bottom row, the raw signals were processed using principal component analysis (Franceschini et al., 2006) to remove systemic effects to produce activation patterns closer to those observed using our Kalman estimator.

Time courses of motor activation. In this figure, we show the region-of-interest time courses from the left (dotted line) and right (solid line) hemispheres. Oxy- (red), deoxy- (blue) and total- (green) hemoglobin traces are shown for each hemisphere, condition, and subject.
References
-
- Boas DA, Chen K, Grebert D, Franceschini MA. Improving the diffuse optical imaging spatial resolution of the cerebral hemodynamic response to brain activation in humans. Opt Lett. 2004;29(13):1506–1508. - PubMed
-
- Cannestra AF, Pouratian N, Shomer MH, Toga AW. Refractory periods observed by intrinsic signal and fluorescent dye imaging. J Neurophysiol. 1998;80(3):1522–1532. - PubMed
-
- Christopher Decharms R. Applications of real-time fMRI. Nat Rev Neurosci. 2008;9(9):720–729. - PubMed
-
- Chute DL. Neuropsychological technologies in rehabilitation. J Head Trauma Rehabil. 2002;17(5):369–377. - PubMed
-
- Cohen-Adad J, Chapuisat S, Doyon J, Rossignol S, Lina JM, Benali H, Lesage F. Activation detection in diffuse optical imaging by means of the general linear model. Med Image Anal. 2007;11(6):616–629. - PubMed
Publication types
MeSH terms
Grants and funding
LinkOut - more resources
Full Text Sources
Other Literature Sources
