. 2009 Aug 15;18(16):3026-38.
doi: 10.1093/hmg/ddp241. Epub 2009 May 20.

Epigenomic profiling indicates a role for DNA methylation in early postnatal liver development

Affiliations

Epigenomic profiling indicates a role for DNA methylation in early postnatal liver development

Robert A Waterland et al. Hum Mol Genet. .

Abstract

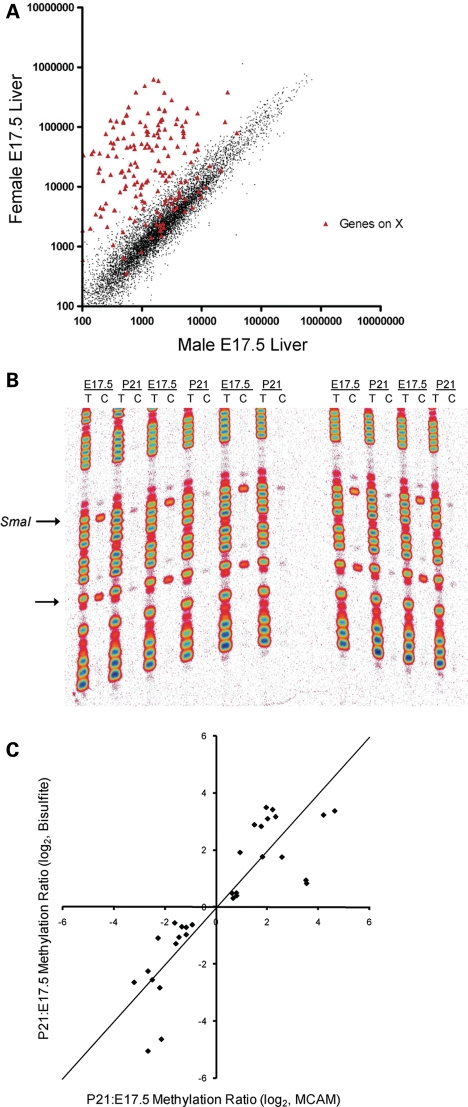
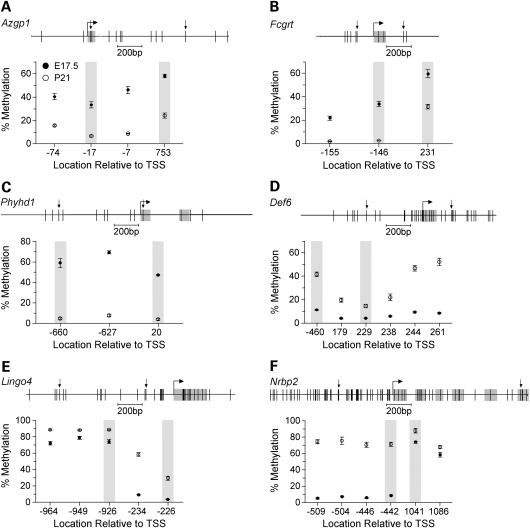
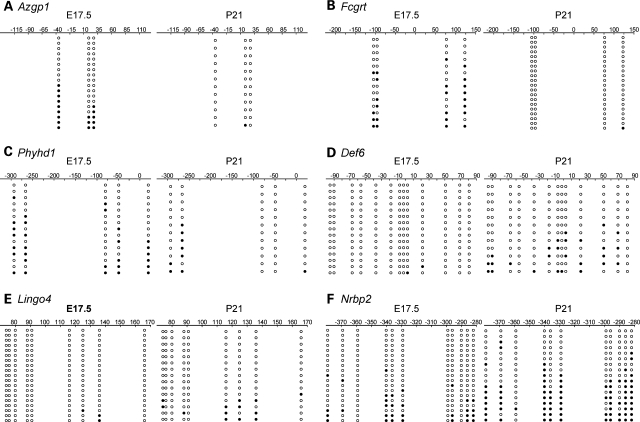
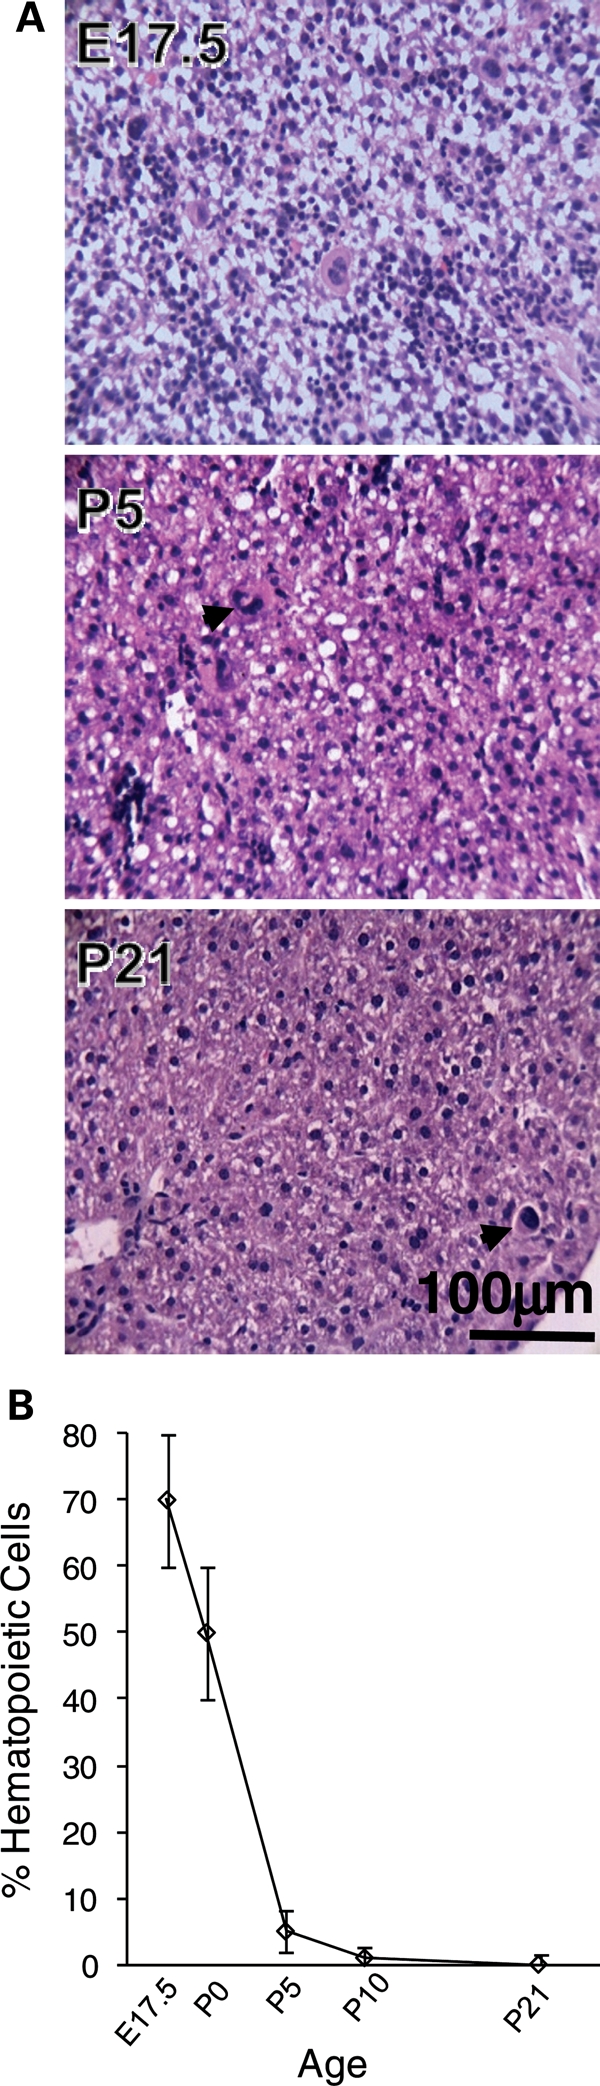
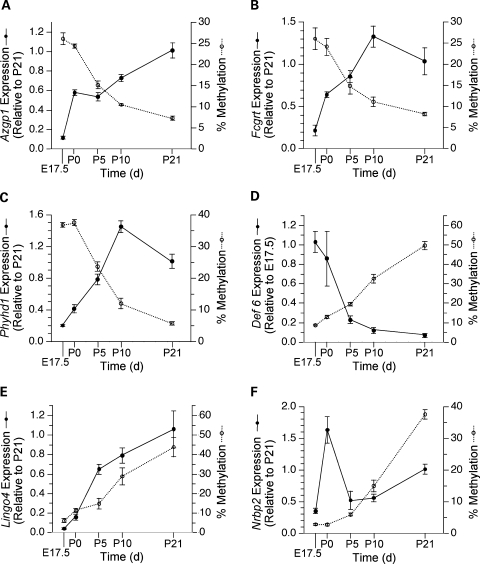
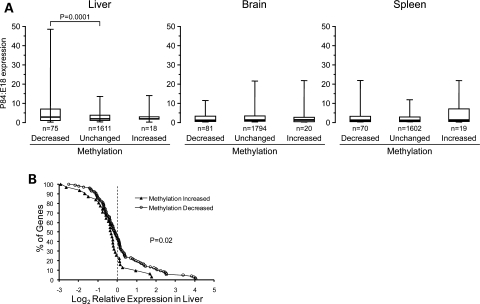
The question of whether DNA methylation contributes to the stabilization of gene expression patterns in differentiated mammalian tissues remains controversial. Using genome-wide methylation profiling, we screened 3757 gene promoters for changes in methylation during postnatal liver development to test the hypothesis that developmental changes in methylation and expression are temporally correlated. We identified 31 genes that gained methylation and 111 that lost methylation from embryonic day 17.5 to postnatal day 21. Promoters undergoing methylation changes in postnatal liver tended not to be associated with CpG islands. At most genes studied, developmental changes in promoter methylation were associated with expression changes, suggesting both that transcriptional inactivity attracts de novo methylation, and that transcriptional activity can override DNA methylation and successively induce developmental hypomethylation. These in vivo data clearly indicate a role for DNA methylation in mammalian differentiation, and provide the novel insight that critical windows in mammalian developmental epigenetics extend well beyond early embryonic development.


Figures

Figure 1.
Figure 1.
Validation of MCAM in the mouse. (A) Scatter plot of normalized signal intensity for a female versus male MCAM cohybridization. Probes not on the X chromosome show close agreement in male and female genomic DNA, whereas those on the X chromosome yield 50–100-fold higher signal in the female than in the male. (B) Manual bisulfite sequencing results at Fcgrt, comparing five E17.5 and five P21 mice. The arrows indicate CpG sites; the upper CpG site is the 5′ end of the SmaI/XmaI interval that yielded a ‘hit’ in the MCAM assay. (C) Scatter plot of P21:E17.5 methylation ratio obtained by bisulfite sequencing versus P21:E17.5 MCAM ratio. In addition to the 13 MCAM hits, three genes that did not meet the final criteria used to identify hits (Mcm2, Gzma and Tex19) are shown. Since two P21 versus E17.5 MCAM cohybridizations were performed, there are two data points for each gene validated. The points do not depart significantly from the line of identity (shown).
Figure 2.
Figure 2.
Detailed analysis of DNA methylation. The upper section of each panel displays the gene region studied by bisulfite sequencing. Vertical lines indicate CpG sites, and downward arrows indicate the boundaries of each informative SmaI/XmaI interval. The lower section of each panel shows percent methylation (Mean ± SEM) versus CpG site location relative to the transcription start site (n = 5 mice per age). Shaded data points indicate the SmaI/XmaI sites that were informative by MCAM. (A) Azgp1. (B) Fcgrt. (C) Phyhd1. (D) Def6. (E) Lingo4. (F) Nrbp2.
Figure 3.
Figure 3.
Clonal bisulfite sequencing results. Each panel compares bisulfite sequencing results for E17.5 and P21. The position relative to the transcription start site is indicated. Each row of circles represents a single clone; open circles represent unmethylated cytosines, and filled circles indicate methylation. In all cases, methylation patterns of individual clones were heterogeneous, and the temporal methylation changes detected in the quantitative assays were corroborated. (A) Azgp1. (B) Fcgrt. (C) Phyhd1. (D) Def6. (E) Lingo4. (F) Nrbp2.
Figure 4.
Figure 4.
Dynamics of hematopoietic cell migration from the liver. (A) Representative high power fields of hematoxylin–eosin stained liver from E17.5, P5 and P21 mice. Note the rapid disappearance of hematopoietic cells between E17.5 and P5 (for description see Materials and Methods) including megakaryocytes (dark arrows), and the coordinate emergence of hepatocytes. Hepatocytes were the dominant cell type by P5. A single megakaryocyte was detected in one of the P21 specimens (shown). (B) Time course showing percentage hematopoietic cells versus age. Each point indicates the mean and SD of livers from 3–5 mice. Hematopoietic cells were the dominant cell type at E17.5, but almost completely gone by P5.
Figure 5.
Figure 5.
Temporal analysis of DNA methylation and expression. Each panel displays both mRNA expression and percentage DNA methylation versus age. Transcript levels are expressed relative to those at P21 or E17.5 (whichever is higher) using the 2−ΔΔCt method. Points represent mean ± SEM of n = 5 mice per age for both expression and methylation. (A) Azgp1. (B) Fcgrt. (C) Phyhd1. (D) Def6. (E) Lingo4. (F) Nrbp2. At Azgp1, Fcgrt, Phyhd1 and Def6 expression is inversely correlated with methylation. At Lingo4 expression and methylation are directly correlated, while at Nrbp2 developmental changes in expression and methylation appear uncoupled.
Figure 6.
Figure 6.
Association of gene expression with postnatal methylation changes. (A) Box plots of P84:E18 expression ratio in liver, brain and spleen of genes that lost or gained methylation from E17.5 to P21, compared with those in which methylation did not change. Each box plot depicts the median (thick line), 25th–75th percentiles (box) and 5th–95th percentiles of the distribution (whiskers). Among genes that lost methylation in liver from E17.5 to P21, the expression increase from E18 to P84 is greater than that of the reference group, specifically in liver. (B) Distribution of expression Z score in liver versus 36 other tissues among genes that either gained or lost methylation from E17.5 to P21. Genes that lost methylation during early postnatal development are generally expressed at higher levels in liver.

References

    1. Jaenisch R., Bird A. Epigenetic regulation of gene expression: how the genome integrates intrinsic and environmental signals. Nat. Genet. 2003;33(Suppl.):245–254. - PubMed
    1. Reik W. Stability and flexibility of epigenetic gene regulation in mammalian development. Nature. 2007;447:425–432. - PubMed
    1. Holliday R., Pugh J.E. DNA modification mechanisms and gene activity during development. Science. 1975;187:226–232. - PubMed
    1. Riggs A.D. X inactivation, differentiation, and DNA methylation. Cytogenet. Cell. Genet. 1975;14:9–25. - PubMed
    1. Walsh C.P., Bestor T.H. Cytosine methylation and mammalian development. Genes Dev. 1999;13:26–34. - PMC - PubMed

Publication types