. 2009 Jun 1;69(11):4613-20.
doi: 10.1158/0008-5472.CAN-08-2816. Epub 2009 May 19.

Fibroblast growth factor receptor 1 promotes proliferation and survival via activation of the mitogen-activated protein kinase pathway in bladder cancer

Affiliations

Fibroblast growth factor receptor 1 promotes proliferation and survival via activation of the mitogen-activated protein kinase pathway in bladder cancer

Darren C Tomlinson et al. Cancer Res. .

Abstract

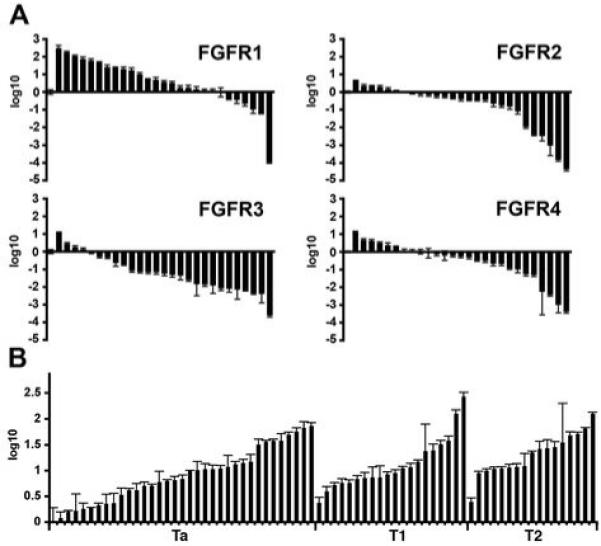
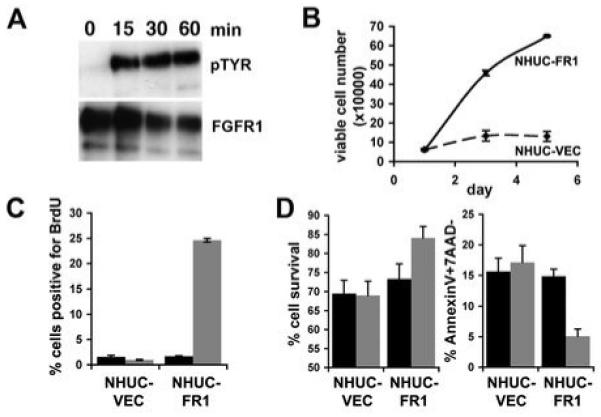
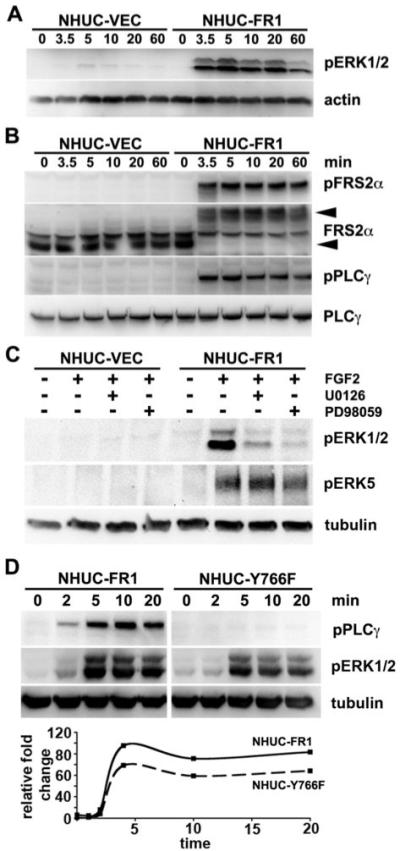
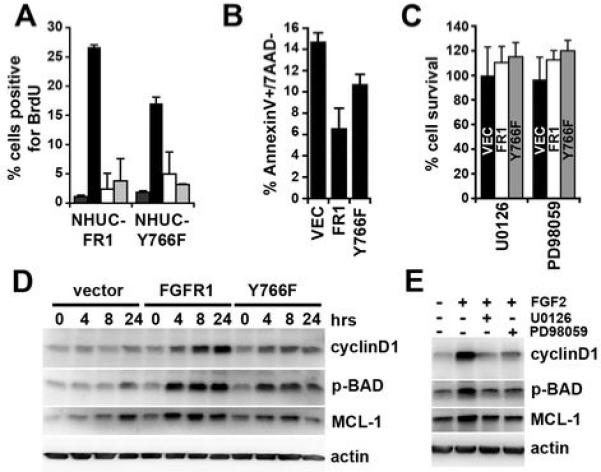
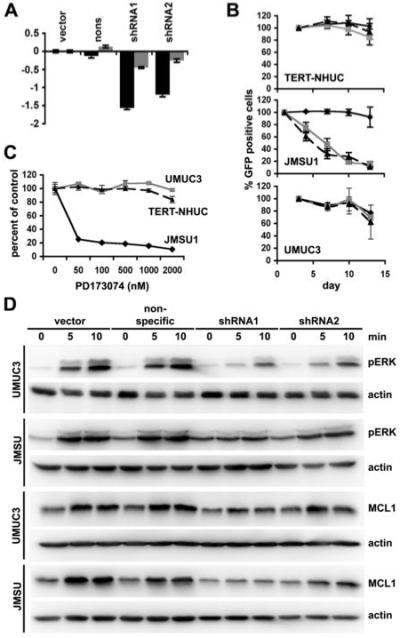
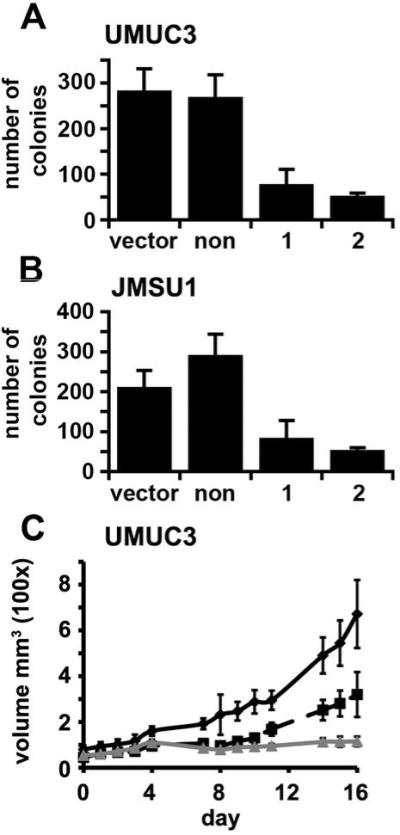
Fibroblast growth factor receptors (FGFR) play key roles in proliferation, differentiation, and tumorigenesis. Many urothelial carcinomas contain activating point mutations or increased expression of FGFR3. However, little is known about the role of other FGFRs. We examined FGFR expression in telomerase-immortalized normal human urothelial cells, urothelial carcinoma cell lines, and tumor samples and showed that FGFR1 expression is increased in a high proportion of cell lines and tumors independent of stage and grade. To determine the role of FGFR1 in low-stage bladder cancer, we overexpressed FGFR1 in telomerase-immortalized normal human urothelial cells and examined changes in proliferation and cell survival in response to FGF2. FGFR1 stimulation increased proliferation and reduced apoptosis. To elucidate the mechanistic basis for these alterations, we examined the signaling cascades activated by FGFR1. FRS2alpha and PLCgamma were activated in response to FGF2, leading to activation of the mitogen-activated protein kinase pathway. The level of mitogen-activated protein kinase activation correlated with the level of cyclin D1, MCL1, and phospho-BAD, which also correlated with FGFR-induced proliferation and survival. Knockdown of FGFR1 in urothelial carcinoma cell lines revealed differential FGFR1 dependence. JMSU1 cells were dependent on FGFR1 expression for survival but three other cell lines were not. Two cell lines (JMSU1 and UMUC3) were dependent on FGFR1 for growth in soft agar. Only one of the cell lines tested (UMUC3) was frankly tumorigenic; here, FGFR1 knockdown inhibited tumor growth. Our results indicate that FGFR1 has significant effects on urothelial cell phenotype and may represent a useful therapeutic target in some cases of urothelial carcinoma.


Figures

Figure 1
Figure 1
Expression levels of FGFRs in bladder cancer cell lines and bladder tumors. Transcript levels were measured by real-time RT-PCR and normalised to SDHA. Values represent fold difference compared to NHUC. A, FGFR transcript levels in 27 bladder cancer cell lines; fold change is represented using log10. B, FGFR1 transcript levels in 35 Ta, 20 T1 and 18 T2 bladder tumors.
Figure 2
Figure 2
Activation of FGFR1 regulates proliferation and survival. A, Immunoprecipitation of FGFR1 from NHUC-FR1 cultured with FGF2 for 15, 30 and 60 minutes. Blots were probed with an anti-phosphotyrosine antibody (pTYR) and reprobed with anti-FGFR1 antibody as loading control. B, NHUC-VEC (dashed line) and NHUC-FR1 (solid line) were grown in supplement-free medium with heparin and FGF2 (10ng/ml). C, NHUC-VEC and NHUC-FR1 were grown in supplement-free medium with heparin (black bar), or heparin and FGF2 (grey bar) for 24 hours prior to addition of BrdU. BrdU incorporation was measured by FACS. D, NHUC-VEC and NHUC-FR1 were grown in supplement-free medium for 96 hours in the presence of heparin (black bar), or heparin and FGF2 (grey bar). Viability and apoptosis were analysed by FACS.
Figure 3
Figure 3
FGFR1 activates the MAPK pathway. Cells were cultured in supplement-free medium for 1 hour prior to culture with heparin and FGF2 for indicated times. A, Protein lysates were blotted with anti-pERK antibodies then reprobed with anti-actin. B, Protein lysates were blotted with phospho-specific antibodies against FRS2α and PLCγ. Blots were reprobed with anti-FRS2α or PLCγ antibodies. C, Cells were cultured with DMSO (control), U0126 or PD98059 for 1 hour. FGF2 was added for 5 minutes and lysates probed with anti-phospho ERK5 antibody that also cross-reacts with pERK1/2. Blots were reprobed with tubulin. D, NHUC-FR1 and NHUC-Y766F were cultured with FGF2 and lysates blotted for pPLCγ or pERK. Loading contol, tubulin. Graph represents the change in pERK levels in NHUC-FR1 (solid line) and NHUC-Y766F (dashed line) quantified from a representative experiment.
Figure 4
Figure 4
MAPK activation regulates proliferation and survival. A, NHUC-FR1 and NHUC-Y766F were cultured with heparin (dark grey), FGF2 (black), FGF2 and U0126 (white), or FGF2 and PD98059 (light grey) for 24 hours prior to addition of BrdU. BrdU incorporation was analysed using FACS. B, Cells were cultured in supplement-free medium with heparin and FGF2 for 96 hours. Apoptosis was analysed by AnnexinV staining. C, NHUC-VEC (black bar), NHUC-FR1 (white bar) and NHUC-Y766F (grey bar) were cultured with heparin, FGF2 and U0126 or PD98059 for 96 hours. D, NHUC-VEC, NHUC-FR1 and NHUC-Y766F were cultured with heparin and FGF2 for indicated times and their lysates blotted for cyclinD1, MCL1 and phosphorylated BAD. E, NHUC-FR1 were cultured with indicated substances for 4 hours and their lysates blotted for cyclin D1, MCL1 and phosphorylated BAD.
Figure 5
Figure 5
Bladder cancer cell line dependence on FGFR1. A, FGFR1 transcript levels in JMSU1 (grey bars) and UMUC3 (black bars) transduced with vector, non-specific shRNA, shRNA1 or shRNA2 were measured by real-time RT-PCR. B, TERT-NHUC, JMSU1 and UMUC3 were transduced with non-specific shRNA (solid black), shRNA1 (dashed black), or shRNA2 (grey) in retroviruses expressing GFP. Graph represents the percentage of GFP expressing cells remaining in culture compared to the number at the start of the experiment. C, TERT-NHUC (dashed black), UMUC3 (grey) and JMSU1 (solid black) were cultured with FGFR inhibitor PD173074. Cell survival was determined by MTT assay. D, JMSU1 and UMUC3 were starved in 0.1% FCS for 24 hours prior to culture with heparin and FGF2. Lysates were probed for pERK, MCL1 and actin.
Figure 6
Figure 6
FGFR1 knockdown reduces anchorage independent growth and growth in vivo. UMUC3 (A) or JMSU1 (B) expressing a non-specific shRNA, shRNA1 or shRNA2 were cultured in soft agar for 21 days and stained with p-iodonitrotretrazolium violet. Graph shows viable colonies greater than 1mm in size per 10cm2. UMUC3 were injected subcutaneously into nude mice and tumor volume measured (C). Solid black line, cells expressing the non-specific control; dashed black line, cells expressing shRNA1; grey line, cells expressing shRNA2. Error bars represent standard error.

References

    1. Jemal A, Siegel R, Ward E, et al. Cancer statistics, 2008. CA Cancer J Clin. 2008;58:71–96. - PubMed
    1. Cancer Research UK . UK Bladder Cancer Statistics. 2008.
    1. Knowles MA. Molecular subtypes of bladder cancer: Jekyll and Hyde or chalk and cheese? Carcinogenesis. 2006;27:361–73. - PubMed
    1. Wu XR. Urothelial tumorigenesis: a tale of divergent pathways. Nat Rev Cancer. 2005;5:713–25. - PubMed
    1. Sangar VK, Ragavan N, Matanhelia SS, Watson MW, Blades RA. The economic consequences of prostate and bladder cancer in the UK. BJU Int. 2005;95:59–63. - PubMed

Publication types

MeSH terms

Substances